GenesisEnergy GEL full analysis,charts,indicators,moving averages,SMA,DMA,EMA,ADX,MACD,RSIGenesis Energy GEL WideScreen charts, DMA,SMA,EMA technical analysis, forecast prediction, by indicators ADX,MACD,RSI,CCI USA stock exchange
operates under Energy sector & deals in Oil Refining Marketing
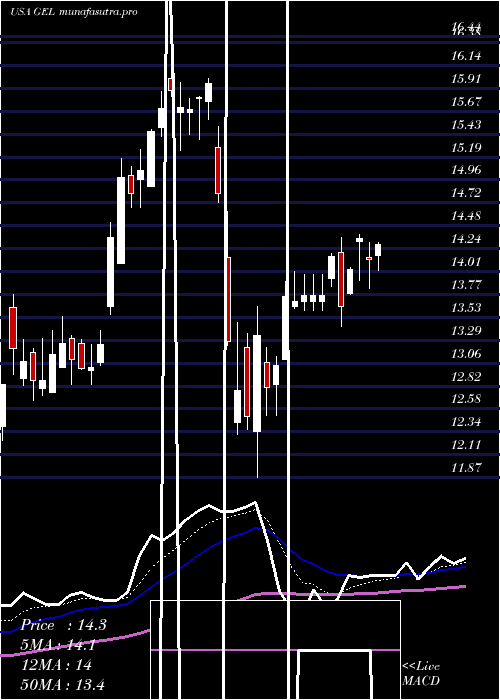
Daily price and charts and targets GenesisEnergy Strong Daily Stock price targets for GenesisEnergy GEL are 15.31 and 15.73 | Daily Target 1 | 14.97 | | Daily Target 2 | 15.23 | | Daily Target 3 | 15.386666666667 | | Daily Target 4 | 15.65 | | Daily Target 5 | 15.81 |
Daily price and volume Genesis Energy
| Date |
Closing |
Open |
Range |
Volume |
Mon 20 October 2025 |
15.50 (2.65%) |
15.22 |
15.12 - 15.54 |
0.6276 times |
Fri 17 October 2025 |
15.10 (0.6%) |
15.09 |
14.95 - 15.20 |
0.9229 times |
Thu 16 October 2025 |
15.01 (-3.29%) |
15.49 |
14.85 - 15.49 |
0.89 times |
Wed 15 October 2025 |
15.52 (1.24%) |
15.42 |
15.21 - 15.65 |
0.8821 times |
Tue 14 October 2025 |
15.33 (-1.48%) |
15.43 |
15.25 - 15.51 |
0.9005 times |
Mon 13 October 2025 |
15.56 (4.22%) |
15.20 |
15.08 - 15.70 |
1.2898 times |
Fri 10 October 2025 |
14.93 (-3.11%) |
15.10 |
14.55 - 15.59 |
1.0497 times |
Thu 09 October 2025 |
15.41 (-3.26%) |
15.89 |
15.34 - 16.14 |
1.2968 times |
Wed 08 October 2025 |
15.93 (0.63%) |
15.97 |
15.77 - 16.04 |
0.6815 times |
Tue 07 October 2025 |
15.83 (-1.55%) |
16.13 |
15.59 - 16.19 |
1.4592 times |
Mon 06 October 2025 |
16.08 (-0.8%) |
16.26 |
16.08 - 16.35 |
0.3965 times |
Weekly price and charts GenesisEnergy Strong weekly Stock price targets for GenesisEnergy GEL are 15.31 and 15.73 | Weekly Target 1 | 14.97 | | Weekly Target 2 | 15.23 | | Weekly Target 3 | 15.386666666667 | | Weekly Target 4 | 15.65 | | Weekly Target 5 | 15.81 |
Weekly price and volumes for Genesis Energy
| Date |
Closing |
Open |
Range |
Volume |
Mon 20 October 2025 |
15.50 (2.65%) |
15.22 |
15.12 - 15.54 |
0.0919 times |
Fri 17 October 2025 |
15.10 (1.14%) |
15.20 |
14.85 - 15.70 |
0.7156 times |
Fri 10 October 2025 |
14.93 (-7.9%) |
16.26 |
14.55 - 16.35 |
0.7154 times |
Fri 03 October 2025 |
16.21 (-2.41%) |
16.50 |
16.09 - 16.80 |
0.6535 times |
Fri 26 September 2025 |
16.61 (0.42%) |
16.49 |
16.12 - 16.79 |
0.8302 times |
Fri 19 September 2025 |
16.54 (0%) |
16.60 |
15.86 - 16.97 |
1.1402 times |
Fri 12 September 2025 |
16.54 (-0.42%) |
16.86 |
16.23 - 17.04 |
1.4846 times |
Fri 05 September 2025 |
16.61 (-2.24%) |
16.90 |
16.13 - 16.95 |
1.0927 times |
Fri 29 August 2025 |
16.99 (0%) |
17.24 |
16.99 - 17.36 |
1.1867 times |
Fri 29 August 2025 |
16.99 (-0.7%) |
17.14 |
16.66 - 17.39 |
2.0892 times |
Fri 22 August 2025 |
17.11 (1.24%) |
16.81 |
16.63 - 17.52 |
1.4238 times |
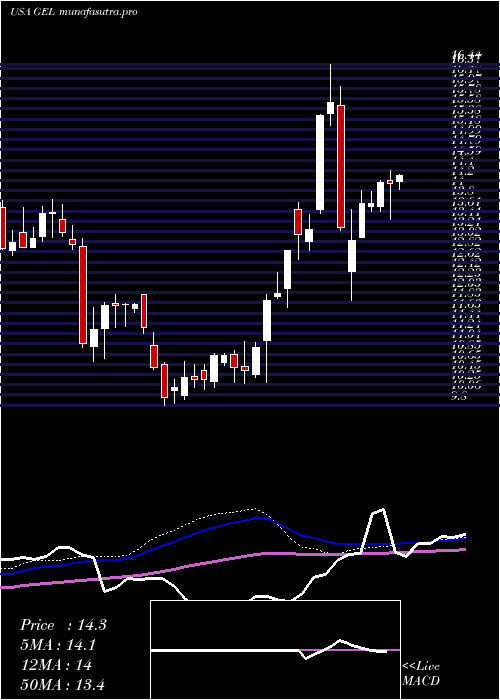
Monthly price and charts GenesisEnergy Strong monthly Stock price targets for GenesisEnergy GEL are 13.9 and 16.15 | Monthly Target 1 | 13.37 | | Monthly Target 2 | 14.43 | | Monthly Target 3 | 15.616666666667 | | Monthly Target 4 | 16.68 | | Monthly Target 5 | 17.87 |
Monthly price and volumes Genesis Energy
| Date |
Closing |
Open |
Range |
Volume |
Mon 20 October 2025 |
15.50 (-7.24%) |
16.56 |
14.55 - 16.80 |
0.2813 times |
Tue 30 September 2025 |
16.71 (-1.65%) |
16.90 |
15.86 - 17.04 |
0.7107 times |
Fri 29 August 2025 |
16.99 (-2.13%) |
17.35 |
16.36 - 17.52 |
1.0411 times |
Thu 31 July 2025 |
17.36 (0.75%) |
17.23 |
15.68 - 17.77 |
0.9107 times |
Mon 30 June 2025 |
17.23 (9.26%) |
15.90 |
15.34 - 17.43 |
1.1783 times |
Fri 30 May 2025 |
15.77 (14.77%) |
13.58 |
13.21 - 16.79 |
0.9158 times |
Wed 30 April 2025 |
13.74 (-12.43%) |
15.80 |
11.87 - 16.01 |
0.8461 times |
Mon 31 March 2025 |
15.69 (22.2%) |
13.63 |
12.67 - 16.44 |
1.7045 times |
Fri 28 February 2025 |
12.84 (22.05%) |
10.45 |
10.29 - 12.84 |
1.0731 times |
Fri 31 January 2025 |
10.52 (4.06%) |
10.24 |
10.16 - 11.09 |
1.3386 times |
Tue 31 December 2024 |
10.11 (-14.39%) |
12.00 |
9.86 - 12.00 |
0.7017 times |

DMA SMA EMA moving averages of Genesis Energy GEL
DMA (daily moving average) of Genesis Energy GEL
| DMA period | DMA value | | 5 day DMA | 15.29 | | 12 day DMA | 15.53 | | 20 day DMA | 15.94 | | 35 day DMA | 16.19 | | 50 day DMA | 16.43 | | 100 day DMA | 16.56 | | 150 day DMA | 15.88 | | 200 day DMA | 14.75 | EMA (exponential moving average) of Genesis Energy GEL
| EMA period | EMA current | EMA prev | EMA prev2 | | 5 day EMA | 15.33 | 15.25 | 15.33 | | 12 day EMA | 15.55 | 15.56 | 15.64 | | 20 day EMA | 15.78 | 15.81 | 15.88 | | 35 day EMA | 16.08 | 16.11 | 16.17 | | 50 day EMA | 16.36 | 16.39 | 16.44 |
SMA (simple moving average) of Genesis Energy GEL
| SMA period | SMA current | SMA prev | SMA prev2 | | 5 day SMA | 15.29 | 15.3 | 15.27 | | 12 day SMA | 15.53 | 15.59 | 15.71 | | 20 day SMA | 15.94 | 15.98 | 16.05 | | 35 day SMA | 16.19 | 16.23 | 16.28 | | 50 day SMA | 16.43 | 16.45 | 16.49 | | 100 day SMA | 16.56 | 16.57 | 16.58 | | 150 day SMA | 15.88 | 15.86 | 15.85 | | 200 day SMA | 14.75 | 14.73 | 14.7 |
|
|
