GeneralElectric GE full analysis,charts,indicators,moving averages,SMA,DMA,EMA,ADX,MACD,RSIGeneral Electric GE WideScreen charts, DMA,SMA,EMA technical analysis, forecast prediction, by indicators ADX,MACD,RSI,CCI USA stock exchange
operates under Energy sector & deals in Consumer Electronics Appliances
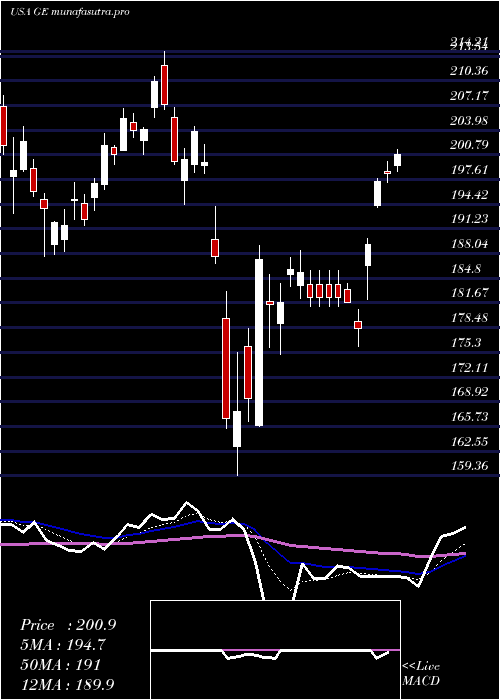
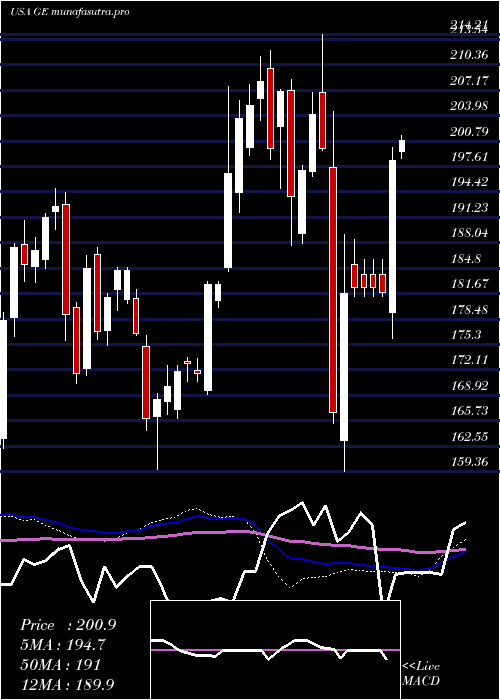
Daily price and charts and targets GeneralElectric Strong Daily Stock price targets for GeneralElectric GE are 289.76 and 296.64 | Daily Target 1 | 284.47 | | Daily Target 2 | 288.17 | | Daily Target 3 | 291.35333333333 | | Daily Target 4 | 295.05 | | Daily Target 5 | 298.23 |
Daily price and volume General Electric
| Date |
Closing |
Open |
Range |
Volume |
Thu 04 December 2025 |
291.86 (1.17%) |
288.85 |
287.66 - 294.54 |
1.0428 times |
Wed 03 December 2025 |
288.49 (-0.27%) |
288.04 |
284.50 - 289.35 |
1.0091 times |
Tue 02 December 2025 |
289.28 (0.29%) |
288.13 |
288.00 - 292.00 |
0.4653 times |
Mon 01 December 2025 |
288.45 (-3.35%) |
295.75 |
288.03 - 296.40 |
0.9336 times |
Fri 28 November 2025 |
298.45 (0.62%) |
297.01 |
295.26 - 298.68 |
0.3421 times |
Wed 26 November 2025 |
296.62 (1.11%) |
293.95 |
292.65 - 298.61 |
0.3965 times |
Tue 25 November 2025 |
293.35 (-0.24%) |
294.01 |
286.21 - 295.98 |
0.5297 times |
Mon 24 November 2025 |
294.05 (2.3%) |
289.48 |
287.37 - 294.82 |
2.9603 times |
Fri 21 November 2025 |
287.44 (-1.09%) |
290.62 |
284.04 - 291.71 |
1.3924 times |
Thu 20 November 2025 |
290.62 (-3.39%) |
305.40 |
290.48 - 307.08 |
0.9281 times |
Wed 19 November 2025 |
300.82 (1.65%) |
295.86 |
295.50 - 301.67 |
0.734 times |
Weekly price and charts GeneralElectric Strong weekly Stock price targets for GeneralElectric GE are 282.23 and 294.13 | Weekly Target 1 | 279.02 | | Weekly Target 2 | 285.44 | | Weekly Target 3 | 290.92 | | Weekly Target 4 | 297.34 | | Weekly Target 5 | 302.82 |
Weekly price and volumes for General Electric
| Date |
Closing |
Open |
Range |
Volume |
Thu 04 December 2025 |
291.86 (-2.21%) |
295.75 |
284.50 - 296.40 |
1.0074 times |
Fri 28 November 2025 |
298.45 (3.83%) |
289.48 |
286.21 - 298.68 |
1.2344 times |
Fri 21 November 2025 |
287.44 (-5.7%) |
306.82 |
284.04 - 308.82 |
1.2776 times |
Fri 14 November 2025 |
304.82 (-0.8%) |
309.93 |
296.25 - 313.76 |
1.251 times |
Fri 07 November 2025 |
307.27 (-0.54%) |
305.99 |
297.70 - 309.23 |
0.9878 times |
Fri 31 October 2025 |
308.95 (0%) |
311.74 |
307.18 - 314.92 |
0.292 times |
Fri 31 October 2025 |
308.95 (1.65%) |
307.49 |
304.50 - 316.67 |
1.3572 times |
Fri 24 October 2025 |
303.95 (1.27%) |
301.80 |
294.80 - 316.53 |
1.234 times |
Fri 17 October 2025 |
300.14 (-0.53%) |
296.00 |
292.01 - 304.95 |
1.0497 times |
Tue 07 October 2025 |
301.74 (1.6%) |
297.50 |
294.75 - 302.74 |
0.3088 times |
Fri 03 October 2025 |
297.00 (0.68%) |
296.36 |
289.66 - 303.44 |
1.1621 times |
Monthly price and charts GeneralElectric Strong monthly Stock price targets for GeneralElectric GE are 282.23 and 294.13 | Monthly Target 1 | 279.02 | | Monthly Target 2 | 285.44 | | Monthly Target 3 | 290.92 | | Monthly Target 4 | 297.34 | | Monthly Target 5 | 302.82 |
Monthly price and volumes General Electric
| Date |
Closing |
Open |
Range |
Volume |
Thu 04 December 2025 |
291.86 (-2.21%) |
295.75 |
284.50 - 296.40 |
0.1415 times |
Fri 28 November 2025 |
298.45 (-3.4%) |
305.99 |
284.04 - 313.76 |
0.6672 times |
Fri 31 October 2025 |
308.95 (2.7%) |
296.38 |
292.01 - 316.67 |
0.6776 times |
Tue 30 September 2025 |
300.82 (9.31%) |
273.90 |
268.01 - 307.25 |
0.9488 times |
Fri 29 August 2025 |
275.20 (1.52%) |
265.53 |
261.71 - 281.50 |
0.8905 times |
Thu 31 July 2025 |
271.08 (5.32%) |
255.75 |
243.34 - 274.94 |
1.458 times |
Mon 30 June 2025 |
257.39 (4.67%) |
245.85 |
232.24 - 260.55 |
1.5361 times |
Fri 30 May 2025 |
245.91 (22.02%) |
202.25 |
200.86 - 246.86 |
1.1663 times |
Wed 30 April 2025 |
201.54 (0.69%) |
199.56 |
159.36 - 204.50 |
1.5097 times |
Mon 31 March 2025 |
200.15 (-3.3%) |
207.09 |
187.68 - 214.21 |
1.0043 times |
Fri 28 February 2025 |
206.98 (1.68%) |
200.00 |
194.84 - 212.19 |
0.7906 times |

DMA SMA EMA moving averages of General Electric GE
DMA (daily moving average) of General Electric GE
| DMA period | DMA value | | 5 day DMA | 291.31 | | 12 day DMA | 292.95 | | 20 day DMA | 298.44 | | 35 day DMA | 301.75 | | 50 day DMA | 301 | | 100 day DMA | 287.1 | | 150 day DMA | 269.86 | | 200 day DMA | 251.1 | EMA (exponential moving average) of General Electric GE
| EMA period | EMA current | EMA prev | EMA prev2 | | 5 day EMA | 291.22 | 290.9 | 292.1 | | 12 day EMA | 293.88 | 294.25 | 295.3 | | 20 day EMA | 296.35 | 296.82 | 297.7 | | 35 day EMA | 297.94 | 298.3 | 298.88 | | 50 day EMA | 299.4 | 299.71 | 300.17 |
SMA (simple moving average) of General Electric GE
| SMA period | SMA current | SMA prev | SMA prev2 | | 5 day SMA | 291.31 | 292.26 | 293.23 | | 12 day SMA | 292.95 | 293.64 | 295 | | 20 day SMA | 298.44 | 299.1 | 299.89 | | 35 day SMA | 301.75 | 301.99 | 302.32 | | 50 day SMA | 301 | 301.18 | 301.36 | | 100 day SMA | 287.1 | 286.71 | 286.33 | | 150 day SMA | 269.86 | 269.23 | 268.63 | | 200 day SMA | 251.1 | 250.69 | 250.29 |
|
|
