GabelliDividend GDV full analysis,charts,indicators,moving averages,SMA,DMA,EMA,ADX,MACD,RSIGabelli Dividend GDV WideScreen charts, DMA,SMA,EMA technical analysis, forecast prediction, by indicators ADX,MACD,RSI,CCI USA stock exchange
operates under N A sector & deals in N A
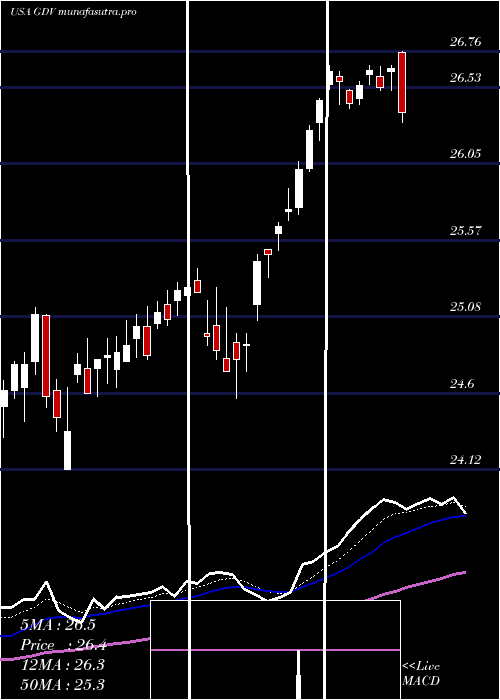
Daily price and charts and targets GabelliDividend Strong Daily Stock price targets for GabelliDividend GDV are 27.11 and 27.36 | Daily Target 1 | 27.05 | | Daily Target 2 | 27.16 | | Daily Target 3 | 27.303333333333 | | Daily Target 4 | 27.41 | | Daily Target 5 | 27.55 |
Daily price and volume Gabelli Dividend
| Date |
Closing |
Open |
Range |
Volume |
Thu 04 December 2025 |
27.26 (-0.04%) |
27.39 |
27.20 - 27.45 |
0.6826 times |
Wed 03 December 2025 |
27.27 (0.66%) |
27.09 |
27.05 - 27.27 |
0.5163 times |
Tue 02 December 2025 |
27.09 (-0.44%) |
27.25 |
27.05 - 27.28 |
0.9228 times |
Mon 01 December 2025 |
27.21 (-0.69%) |
27.33 |
27.16 - 27.35 |
0.938 times |
Fri 28 November 2025 |
27.40 (0.96%) |
27.16 |
26.96 - 27.49 |
0.412 times |
Wed 26 November 2025 |
27.14 (0.44%) |
27.12 |
26.99 - 27.30 |
1.0011 times |
Tue 25 November 2025 |
27.02 (1.05%) |
26.84 |
26.75 - 27.04 |
1.1587 times |
Mon 24 November 2025 |
26.74 (1.29%) |
26.58 |
26.50 - 26.82 |
1.1293 times |
Fri 21 November 2025 |
26.40 (0.84%) |
26.23 |
26.18 - 26.73 |
1.8076 times |
Thu 20 November 2025 |
26.18 (-1.21%) |
26.65 |
26.18 - 27.10 |
1.4315 times |
Wed 19 November 2025 |
26.50 (0.68%) |
26.35 |
26.31 - 26.50 |
1.5565 times |
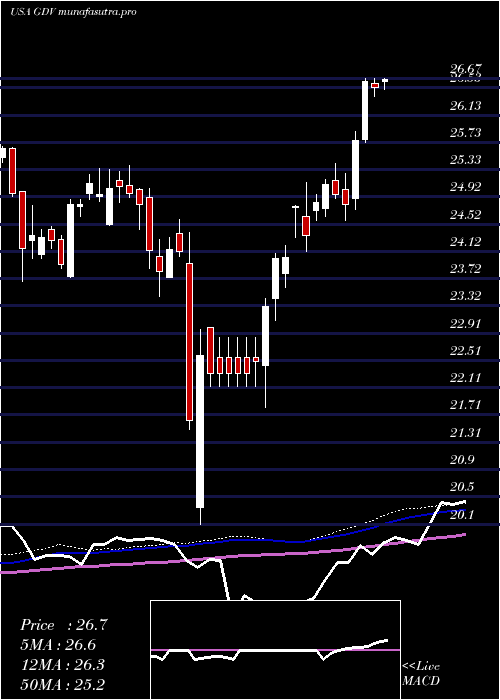
Weekly price and charts GabelliDividend Strong weekly Stock price targets for GabelliDividend GDV are 26.96 and 27.36 | Weekly Target 1 | 26.85 | | Weekly Target 2 | 27.06 | | Weekly Target 3 | 27.253333333333 | | Weekly Target 4 | 27.46 | | Weekly Target 5 | 27.65 |
Weekly price and volumes for Gabelli Dividend
| Date |
Closing |
Open |
Range |
Volume |
Thu 04 December 2025 |
27.26 (-0.51%) |
27.33 |
27.05 - 27.45 |
0.7113 times |
Fri 28 November 2025 |
27.40 (3.79%) |
26.58 |
26.50 - 27.49 |
0.8604 times |
Fri 21 November 2025 |
26.40 (-2.44%) |
27.06 |
26.18 - 27.10 |
1.6652 times |
Fri 14 November 2025 |
27.06 (1.46%) |
26.85 |
26.84 - 27.52 |
1.1 times |
Fri 07 November 2025 |
26.67 (-1.62%) |
26.90 |
26.51 - 27.00 |
1.6329 times |
Fri 31 October 2025 |
27.11 (0%) |
27.10 |
27.01 - 27.16 |
0.1756 times |
Fri 31 October 2025 |
27.11 (-0.51%) |
27.54 |
26.90 - 27.58 |
1.2768 times |
Fri 24 October 2025 |
27.25 (2.14%) |
26.75 |
26.71 - 27.44 |
1.0535 times |
Fri 17 October 2025 |
26.68 (-1.91%) |
26.71 |
26.60 - 27.27 |
1.0138 times |
Tue 07 October 2025 |
27.20 (0.26%) |
27.13 |
27.10 - 27.34 |
0.5105 times |
Fri 03 October 2025 |
27.13 (0.41%) |
27.17 |
26.86 - 27.37 |
0.9718 times |
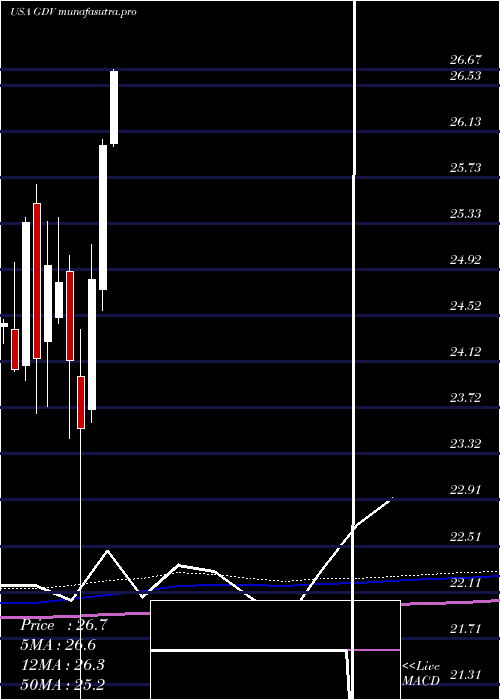
Monthly price and charts GabelliDividend Strong monthly Stock price targets for GabelliDividend GDV are 26.96 and 27.36 | Monthly Target 1 | 26.85 | | Monthly Target 2 | 27.06 | | Monthly Target 3 | 27.253333333333 | | Monthly Target 4 | 27.46 | | Monthly Target 5 | 27.65 |
Monthly price and volumes Gabelli Dividend
| Date |
Closing |
Open |
Range |
Volume |
Thu 04 December 2025 |
27.26 (-0.51%) |
27.33 |
27.05 - 27.45 |
0.1136 times |
Fri 28 November 2025 |
27.40 (1.07%) |
26.90 |
26.18 - 27.52 |
0.8401 times |
Fri 31 October 2025 |
27.11 (-0.07%) |
27.13 |
26.60 - 27.58 |
0.7265 times |
Tue 30 September 2025 |
27.13 (0.71%) |
26.70 |
26.58 - 27.53 |
0.9032 times |
Fri 29 August 2025 |
26.94 (2.28%) |
26.11 |
25.75 - 26.98 |
0.8478 times |
Thu 31 July 2025 |
26.34 (1.27%) |
26.02 |
26.00 - 26.77 |
1.5311 times |
Mon 30 June 2025 |
26.01 (4.71%) |
24.75 |
24.57 - 26.06 |
0.953 times |
Fri 30 May 2025 |
24.84 (5.52%) |
23.70 |
23.59 - 25.14 |
1.3703 times |
Wed 30 April 2025 |
23.54 (-2.45%) |
23.99 |
20.10 - 24.40 |
1.6153 times |
Mon 31 March 2025 |
24.13 (-2.74%) |
24.91 |
23.45 - 25.05 |
1.099 times |
Fri 28 February 2025 |
24.81 (-0.6%) |
24.51 |
24.45 - 25.38 |
0.9343 times |
DMA SMA EMA moving averages of Gabelli Dividend GDV
DMA (daily moving average) of Gabelli Dividend GDV
| DMA period | DMA value | | 5 day DMA | 27.25 | | 12 day DMA | 26.88 | | 20 day DMA | 26.92 | | 35 day DMA | 26.96 | | 50 day DMA | 27.01 | | 100 day DMA | 26.82 | | 150 day DMA | 26.2 | | 200 day DMA | 25.53 | EMA (exponential moving average) of Gabelli Dividend GDV
| EMA period | EMA current | EMA prev | EMA prev2 | | 5 day EMA | 27.19 | 27.15 | 27.09 | | 12 day EMA | 27.05 | 27.01 | 26.96 | | 20 day EMA | 26.99 | 26.96 | 26.93 | | 35 day EMA | 27.01 | 26.99 | 26.97 | | 50 day EMA | 27.05 | 27.04 | 27.03 |
SMA (simple moving average) of Gabelli Dividend GDV
| SMA period | SMA current | SMA prev | SMA prev2 | | 5 day SMA | 27.25 | 27.22 | 27.17 | | 12 day SMA | 26.88 | 26.83 | 26.81 | | 20 day SMA | 26.92 | 26.9 | 26.87 | | 35 day SMA | 26.96 | 26.95 | 26.94 | | 50 day SMA | 27.01 | 27.01 | 27 | | 100 day SMA | 26.82 | 26.82 | 26.81 | | 150 day SMA | 26.2 | 26.17 | 26.14 | | 200 day SMA | 25.53 | 25.52 | 25.51 |
|
|
