WesternAsset GDO full analysis,charts,indicators,moving averages,SMA,DMA,EMA,ADX,MACD,RSIWestern Asset GDO WideScreen charts, DMA,SMA,EMA technical analysis, forecast prediction, by indicators ADX,MACD,RSI,CCI USA stock exchange
operates under N A sector & deals in N A
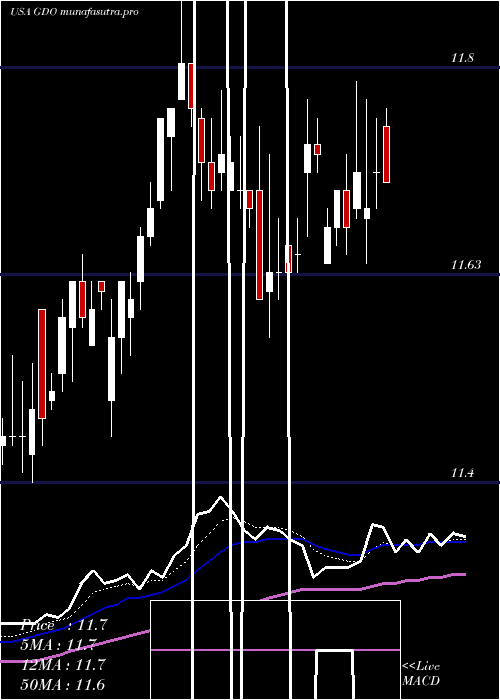
Daily price and charts and targets WesternAsset Strong Daily Stock price targets for WesternAsset GDO are 11.63 and 11.78 | Daily Target 1 | 11.55 | | Daily Target 2 | 11.62 | | Daily Target 3 | 11.696666666667 | | Daily Target 4 | 11.77 | | Daily Target 5 | 11.85 |
Daily price and volume Western Asset
| Date |
Closing |
Open |
Range |
Volume |
Thu 04 December 2025 |
11.70 (0%) |
11.70 |
11.62 - 11.77 |
2.201 times |
Wed 03 December 2025 |
11.70 (0%) |
11.70 |
11.67 - 11.78 |
0.4391 times |
Tue 02 December 2025 |
11.70 (-0.43%) |
11.70 |
11.65 - 11.75 |
0.9243 times |
Mon 01 December 2025 |
11.75 (0.6%) |
11.72 |
11.70 - 11.76 |
1.167 times |
Fri 28 November 2025 |
11.68 (0%) |
11.67 |
11.61 - 11.69 |
0.6586 times |
Wed 26 November 2025 |
11.68 (1.04%) |
11.55 |
11.53 - 11.68 |
1.554 times |
Tue 25 November 2025 |
11.56 (-0.17%) |
11.58 |
11.56 - 11.64 |
0.6875 times |
Mon 24 November 2025 |
11.58 (0.78%) |
11.46 |
11.46 - 11.60 |
0.3466 times |
Fri 21 November 2025 |
11.49 (0.79%) |
11.41 |
11.36 - 11.56 |
0.8839 times |
Thu 20 November 2025 |
11.40 (-2.56%) |
11.52 |
11.40 - 11.66 |
1.1381 times |
Wed 19 November 2025 |
11.70 (0.26%) |
11.62 |
11.62 - 11.71 |
0.6355 times |
Weekly price and charts WesternAsset Strong weekly Stock price targets for WesternAsset GDO are 11.58 and 11.74 | Weekly Target 1 | 11.54 | | Weekly Target 2 | 11.62 | | Weekly Target 3 | 11.7 | | Weekly Target 4 | 11.78 | | Weekly Target 5 | 11.86 |
Weekly price and volumes for Western Asset
| Date |
Closing |
Open |
Range |
Volume |
Thu 04 December 2025 |
11.70 (0.17%) |
11.72 |
11.62 - 11.78 |
0.6807 times |
Fri 28 November 2025 |
11.68 (1.65%) |
11.46 |
11.46 - 11.69 |
0.4671 times |
Fri 21 November 2025 |
11.49 (-0.52%) |
11.52 |
11.36 - 11.72 |
0.8336 times |
Fri 14 November 2025 |
11.55 (1.14%) |
11.47 |
11.41 - 11.70 |
1.4228 times |
Fri 07 November 2025 |
11.42 (-1.97%) |
11.57 |
11.41 - 11.65 |
1.3597 times |
Fri 31 October 2025 |
11.65 (0%) |
11.67 |
11.60 - 11.70 |
0.3042 times |
Fri 31 October 2025 |
11.65 (-0.17%) |
11.69 |
11.60 - 11.90 |
1.6306 times |
Fri 24 October 2025 |
11.67 (-0.93%) |
11.75 |
11.60 - 11.94 |
1.4544 times |
Fri 17 October 2025 |
11.78 (-0.59%) |
11.85 |
11.68 - 12.02 |
0.7837 times |
Fri 10 October 2025 |
11.85 (-1.82%) |
12.06 |
11.84 - 12.14 |
1.0632 times |
Fri 03 October 2025 |
12.07 (1.34%) |
12.01 |
11.83 - 12.11 |
1.4628 times |

Monthly price and charts WesternAsset Strong monthly Stock price targets for WesternAsset GDO are 11.58 and 11.74 | Monthly Target 1 | 11.54 | | Monthly Target 2 | 11.62 | | Monthly Target 3 | 11.7 | | Monthly Target 4 | 11.78 | | Monthly Target 5 | 11.86 |
Monthly price and volumes Western Asset
| Date |
Closing |
Open |
Range |
Volume |
Thu 04 December 2025 |
11.70 (0.17%) |
11.72 |
11.62 - 11.78 |
0.135 times |
Fri 28 November 2025 |
11.68 (0.26%) |
11.57 |
11.36 - 11.72 |
0.8101 times |
Fri 31 October 2025 |
11.65 (-1.94%) |
11.92 |
11.60 - 12.14 |
1.2114 times |
Tue 30 September 2025 |
11.88 (-0.92%) |
11.96 |
11.83 - 12.15 |
1.1824 times |
Fri 29 August 2025 |
11.99 (2.13%) |
11.79 |
11.73 - 12.10 |
1.23 times |
Thu 31 July 2025 |
11.74 (-0.51%) |
11.78 |
11.56 - 11.94 |
1.1481 times |
Mon 30 June 2025 |
11.80 (3.6%) |
11.39 |
11.27 - 11.80 |
1.0628 times |
Fri 30 May 2025 |
11.39 (-0.61%) |
11.44 |
11.12 - 11.54 |
0.9116 times |
Wed 30 April 2025 |
11.46 (-1.04%) |
11.48 |
10.29 - 11.63 |
1.1324 times |
Mon 31 March 2025 |
11.58 (1.67%) |
11.39 |
11.28 - 11.64 |
1.1761 times |
Fri 28 February 2025 |
11.39 (1.24%) |
11.25 |
11.20 - 11.55 |
0.9759 times |

DMA SMA EMA moving averages of Western Asset GDO
DMA (daily moving average) of Western Asset GDO
| DMA period | DMA value | | 5 day DMA | 11.71 | | 12 day DMA | 11.63 | | 20 day DMA | 11.6 | | 35 day DMA | 11.64 | | 50 day DMA | 11.73 | | 100 day DMA | 11.81 | | 150 day DMA | 11.72 | | 200 day DMA | 11.61 | EMA (exponential moving average) of Western Asset GDO
| EMA period | EMA current | EMA prev | EMA prev2 | | 5 day EMA | 11.69 | 11.68 | 11.67 | | 12 day EMA | 11.65 | 11.64 | 11.63 | | 20 day EMA | 11.65 | 11.65 | 11.65 | | 35 day EMA | 11.69 | 11.69 | 11.69 | | 50 day EMA | 11.76 | 11.76 | 11.76 |
SMA (simple moving average) of Western Asset GDO
| SMA period | SMA current | SMA prev | SMA prev2 | | 5 day SMA | 11.71 | 11.7 | 11.67 | | 12 day SMA | 11.63 | 11.63 | 11.62 | | 20 day SMA | 11.6 | 11.59 | 11.59 | | 35 day SMA | 11.64 | 11.65 | 11.65 | | 50 day SMA | 11.73 | 11.74 | 11.74 | | 100 day SMA | 11.81 | 11.81 | 11.81 | | 150 day SMA | 11.72 | 11.72 | 11.71 | | 200 day SMA | 11.61 | 11.61 | 11.6 |
|
|
