GoldenEntertainment GDEN full analysis,charts,indicators,moving averages,SMA,DMA,EMA,ADX,MACD,RSIGolden Entertainment GDEN WideScreen charts, DMA,SMA,EMA technical analysis, forecast prediction, by indicators ADX,MACD,RSI,CCI USA stock exchange
operates under Consumer Services sector & deals in Services Misc Amusement Recreation
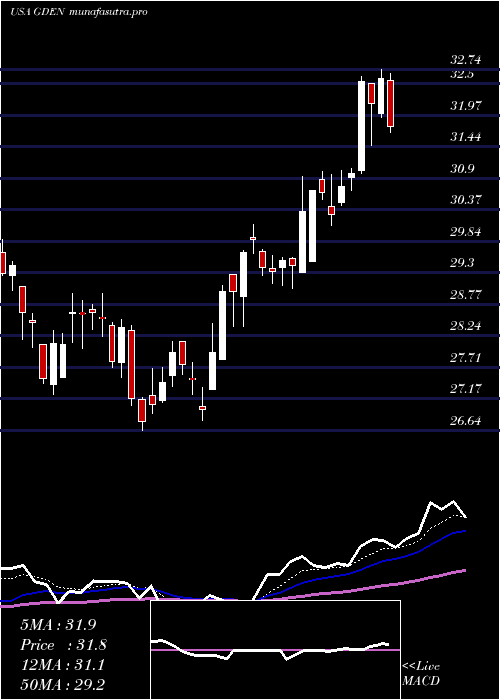
Daily price and charts and targets GoldenEntertainment Strong Daily Stock price targets for GoldenEntertainment GDEN are 27.76 and 28.15 | Daily Target 1 | 27.69 | | Daily Target 2 | 27.83 | | Daily Target 3 | 28.08 | | Daily Target 4 | 28.22 | | Daily Target 5 | 28.47 |
Daily price and volume Golden Entertainment
| Date |
Closing |
Open |
Range |
Volume |
Fri 05 December 2025 |
27.97 (-1.38%) |
28.15 |
27.94 - 28.33 |
0.9328 times |
Thu 04 December 2025 |
28.36 (-0.56%) |
28.38 |
27.96 - 28.53 |
0.9866 times |
Wed 03 December 2025 |
28.52 (0.32%) |
28.61 |
28.26 - 28.86 |
0.8536 times |
Tue 02 December 2025 |
28.43 (-2.77%) |
29.45 |
28.29 - 29.45 |
1.2347 times |
Mon 01 December 2025 |
29.24 (-2.6%) |
29.80 |
29.11 - 30.02 |
1.2217 times |
Fri 28 November 2025 |
30.02 (0.3%) |
29.93 |
29.42 - 30.05 |
0.2469 times |
Wed 26 November 2025 |
29.93 (1.32%) |
29.49 |
29.48 - 30.22 |
1.2347 times |
Tue 25 November 2025 |
29.54 (1.72%) |
29.04 |
29.04 - 30.05 |
1.1664 times |
Mon 24 November 2025 |
29.04 (-1.66%) |
29.50 |
28.81 - 29.53 |
1.2675 times |
Fri 21 November 2025 |
29.53 (2.71%) |
28.98 |
28.78 - 29.75 |
0.8551 times |
Thu 20 November 2025 |
28.75 (-1.34%) |
29.35 |
28.73 - 29.48 |
1.218 times |
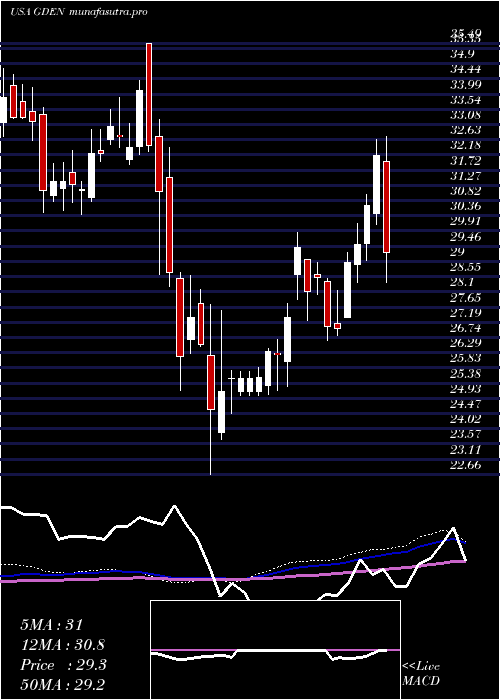
Weekly price and charts GoldenEntertainment Strong weekly Stock price targets for GoldenEntertainment GDEN are 26.92 and 29 | Weekly Target 1 | 26.56 | | Weekly Target 2 | 27.27 | | Weekly Target 3 | 28.643333333333 | | Weekly Target 4 | 29.35 | | Weekly Target 5 | 30.72 |
Weekly price and volumes for Golden Entertainment
| Date |
Closing |
Open |
Range |
Volume |
Fri 05 December 2025 |
27.97 (-6.83%) |
29.80 |
27.94 - 30.02 |
0.8876 times |
Fri 28 November 2025 |
30.02 (1.66%) |
29.50 |
28.81 - 30.22 |
0.6646 times |
Fri 21 November 2025 |
29.53 (-1.99%) |
30.13 |
28.73 - 30.27 |
0.9584 times |
Fri 14 November 2025 |
30.13 (3.08%) |
29.43 |
29.27 - 30.27 |
2.1278 times |
Fri 07 November 2025 |
29.23 (44.7%) |
20.13 |
19.57 - 30.20 |
2.9372 times |
Fri 31 October 2025 |
20.20 (0%) |
20.46 |
20.05 - 20.55 |
0.104 times |
Fri 31 October 2025 |
20.20 (-8.35%) |
22.06 |
20.05 - 22.73 |
0.5907 times |
Fri 24 October 2025 |
22.04 (-2.22%) |
22.73 |
21.94 - 23.13 |
0.4942 times |
Fri 17 October 2025 |
22.54 (5.13%) |
21.61 |
21.28 - 22.76 |
0.4436 times |
Fri 10 October 2025 |
21.44 (-9.38%) |
23.75 |
21.33 - 23.81 |
0.7918 times |
Fri 03 October 2025 |
23.66 (2.03%) |
23.39 |
22.88 - 24.07 |
0.5884 times |
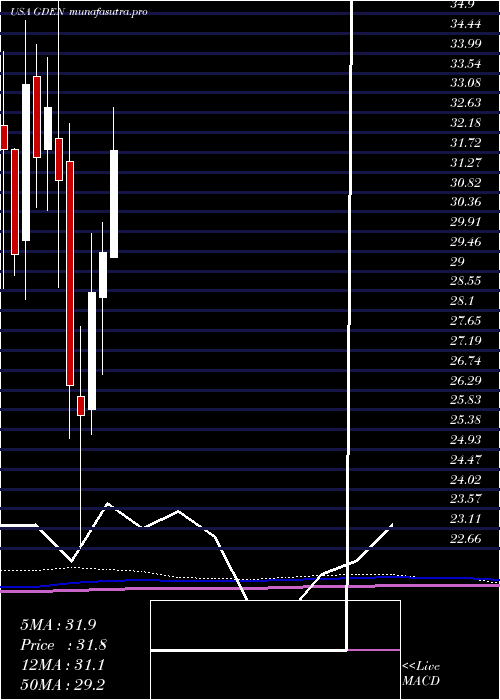
Monthly price and charts GoldenEntertainment Strong monthly Stock price targets for GoldenEntertainment GDEN are 26.92 and 29 | Monthly Target 1 | 26.56 | | Monthly Target 2 | 27.27 | | Monthly Target 3 | 28.643333333333 | | Monthly Target 4 | 29.35 | | Monthly Target 5 | 30.72 |
Monthly price and volumes Golden Entertainment
| Date |
Closing |
Open |
Range |
Volume |
Fri 05 December 2025 |
27.97 (-6.83%) |
29.80 |
27.94 - 30.02 |
0.3363 times |
Fri 28 November 2025 |
30.02 (48.61%) |
20.13 |
19.57 - 30.27 |
2.5337 times |
Fri 31 October 2025 |
20.20 (-14.33%) |
23.38 |
20.05 - 24.07 |
1.0282 times |
Tue 30 September 2025 |
23.58 (-5.19%) |
24.63 |
22.67 - 25.17 |
0.8342 times |
Fri 29 August 2025 |
24.87 (-11.56%) |
27.70 |
24.08 - 28.13 |
0.9219 times |
Thu 31 July 2025 |
28.12 (-4.45%) |
29.31 |
28.00 - 32.74 |
0.8393 times |
Mon 30 June 2025 |
29.43 (3.15%) |
28.41 |
26.64 - 30.13 |
0.8005 times |
Fri 30 May 2025 |
28.53 (11.01%) |
25.83 |
25.28 - 29.86 |
0.7671 times |
Wed 30 April 2025 |
25.70 (-2.61%) |
26.14 |
22.66 - 27.73 |
0.9236 times |
Mon 31 March 2025 |
26.39 (-15.12%) |
31.52 |
25.17 - 32.39 |
1.0152 times |
Fri 28 February 2025 |
31.09 (-5.04%) |
32.04 |
28.63 - 35.49 |
0.8175 times |
DMA SMA EMA moving averages of Golden Entertainment GDEN
DMA (daily moving average) of Golden Entertainment GDEN
| DMA period | DMA value | | 5 day DMA | 28.5 | | 12 day DMA | 29.04 | | 20 day DMA | 29.3 | | 35 day DMA | 26.23 | | 50 day DMA | 25.16 | | 100 day DMA | 25.47 | | 150 day DMA | 26.57 | | 200 day DMA | 26.79 | EMA (exponential moving average) of Golden Entertainment GDEN
| EMA period | EMA current | EMA prev | EMA prev2 | | 5 day EMA | 28.49 | 28.75 | 28.95 | | 12 day EMA | 28.67 | 28.8 | 28.88 | | 20 day EMA | 28.17 | 28.19 | 28.17 | | 35 day EMA | 27.08 | 27.03 | 26.95 | | 50 day EMA | 25.39 | 25.28 | 25.15 |
SMA (simple moving average) of Golden Entertainment GDEN
| SMA period | SMA current | SMA prev | SMA prev2 | | 5 day SMA | 28.5 | 28.91 | 29.23 | | 12 day SMA | 29.04 | 29.19 | 29.32 | | 20 day SMA | 29.3 | 29.33 | 28.97 | | 35 day SMA | 26.23 | 26.08 | 25.9 | | 50 day SMA | 25.16 | 25.06 | 24.96 | | 100 day SMA | 25.47 | 25.48 | 25.51 | | 150 day SMA | 26.57 | 26.55 | 26.54 | | 200 day SMA | 26.79 | 26.82 | 26.84 |
|
|
