TegnaInc GCI full analysis,charts,indicators,moving averages,SMA,DMA,EMA,ADX,MACD,RSITegna Inc GCI WideScreen charts, DMA,SMA,EMA technical analysis, forecast prediction, by indicators ADX,MACD,RSI,CCI USA stock exchange
operates under Consumer Services sector & deals in Newspapers Magazines
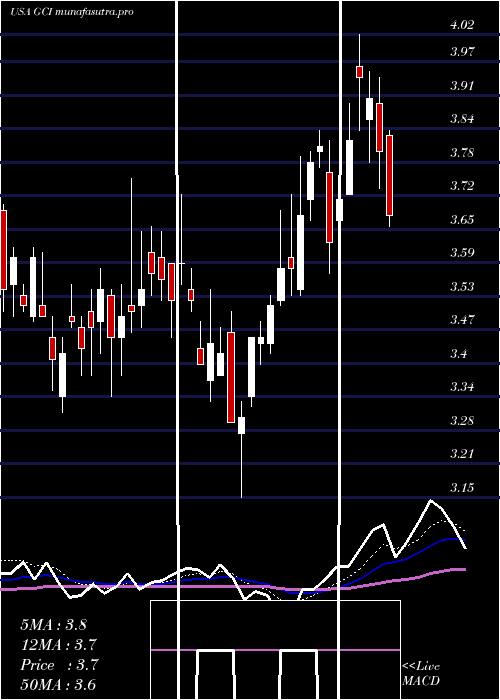
Daily price and charts and targets TegnaInc Strong Daily Stock price targets for TegnaInc GCI are 3.84 and 4.23 | Daily Target 1 | 3.52 | | Daily Target 2 | 3.77 | | Daily Target 3 | 3.91 | | Daily Target 4 | 4.16 | | Daily Target 5 | 4.3 |
Daily price and volume Tegna Inc
| Date |
Closing |
Open |
Range |
Volume |
Fri 01 August 2025 |
4.02 (5.51%) |
3.73 |
3.66 - 4.05 |
1.1476 times |
Thu 31 July 2025 |
3.81 (4.38%) |
3.94 |
3.72 - 4.17 |
1.9828 times |
Wed 30 July 2025 |
3.65 (0.83%) |
3.65 |
3.58 - 4.14 |
2.2321 times |
Tue 29 July 2025 |
3.62 (-3.72%) |
3.80 |
3.58 - 3.80 |
0.9969 times |
Mon 28 July 2025 |
3.76 (1.9%) |
3.70 |
3.65 - 3.78 |
0.3906 times |
Fri 25 July 2025 |
3.69 (-0.27%) |
3.70 |
3.57 - 3.70 |
0.5286 times |
Thu 24 July 2025 |
3.70 (-2.63%) |
3.76 |
3.62 - 3.77 |
0.7847 times |
Wed 23 July 2025 |
3.80 (1.88%) |
3.77 |
3.71 - 3.81 |
0.3628 times |
Tue 22 July 2025 |
3.73 (4.78%) |
3.56 |
3.55 - 3.80 |
1.0345 times |
Mon 21 July 2025 |
3.56 (0.56%) |
3.56 |
3.52 - 3.59 |
0.5394 times |
Fri 18 July 2025 |
3.54 (-2.21%) |
3.64 |
3.51 - 3.65 |
0.9616 times |
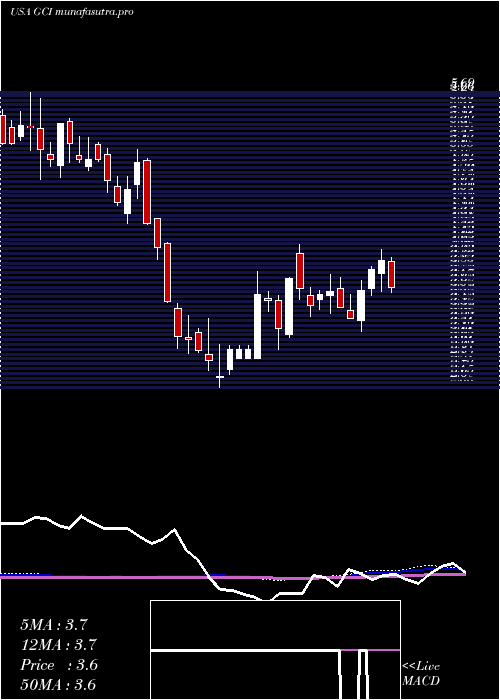
Weekly price and charts TegnaInc Strong weekly Stock price targets for TegnaInc GCI are 3.8 and 4.39 | Weekly Target 1 | 3.33 | | Weekly Target 2 | 3.68 | | Weekly Target 3 | 3.9233333333333 | | Weekly Target 4 | 4.27 | | Weekly Target 5 | 4.51 |
Weekly price and volumes for Tegna Inc
| Date |
Closing |
Open |
Range |
Volume |
Fri 01 August 2025 |
4.02 (8.94%) |
3.70 |
3.58 - 4.17 |
1.9163 times |
Fri 25 July 2025 |
3.69 (4.24%) |
3.56 |
3.52 - 3.81 |
0.9226 times |
Fri 18 July 2025 |
3.54 (-9.23%) |
3.89 |
3.51 - 3.94 |
0.9426 times |
Fri 11 July 2025 |
3.90 (2.36%) |
3.76 |
3.57 - 4.02 |
1.0741 times |
Thu 03 July 2025 |
3.81 (6.42%) |
3.60 |
3.53 - 3.84 |
0.4825 times |
Fri 27 June 2025 |
3.58 (8.81%) |
3.27 |
3.15 - 3.69 |
1.0632 times |
Fri 20 June 2025 |
3.29 (-3.24%) |
3.37 |
3.29 - 3.54 |
0.8819 times |
Fri 13 June 2025 |
3.40 (-4.76%) |
3.60 |
3.40 - 3.72 |
0.9596 times |
Fri 06 June 2025 |
3.57 (0.85%) |
3.53 |
3.34 - 3.75 |
1.2041 times |
Fri 30 May 2025 |
3.54 (3.51%) |
3.49 |
3.38 - 3.58 |
0.553 times |
Fri 23 May 2025 |
3.42 (-5%) |
3.53 |
3.31 - 3.62 |
0.7056 times |
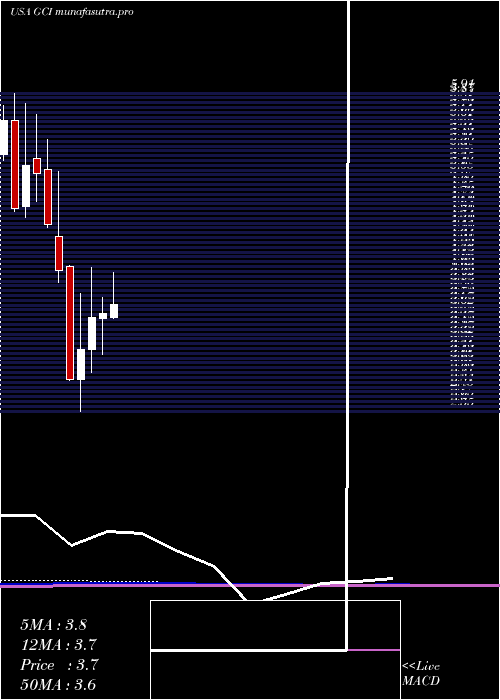
Monthly price and charts TegnaInc Strong monthly Stock price targets for TegnaInc GCI are 3.84 and 4.23 | Monthly Target 1 | 3.52 | | Monthly Target 2 | 3.77 | | Monthly Target 3 | 3.91 | | Monthly Target 4 | 4.16 | | Monthly Target 5 | 4.3 |
Monthly price and volumes Tegna Inc
| Date |
Closing |
Open |
Range |
Volume |
Fri 01 August 2025 |
4.02 (5.51%) |
3.73 |
3.66 - 4.05 |
0.0968 times |
Thu 31 July 2025 |
3.81 (6.42%) |
3.54 |
3.51 - 4.17 |
1.4416 times |
Mon 30 June 2025 |
3.58 (1.13%) |
3.53 |
3.15 - 3.75 |
1.2686 times |
Fri 30 May 2025 |
3.54 (10.63%) |
3.20 |
2.96 - 4.07 |
1.2693 times |
Wed 30 April 2025 |
3.20 (10.73%) |
2.89 |
2.55 - 3.79 |
1.6233 times |
Mon 31 March 2025 |
2.89 (-28.47%) |
4.08 |
2.87 - 4.09 |
1.1308 times |
Fri 28 February 2025 |
4.04 (-10.62%) |
4.40 |
3.91 - 5.08 |
0.8628 times |
Fri 31 January 2025 |
4.52 (-10.67%) |
5.11 |
4.49 - 5.42 |
0.8005 times |
Tue 31 December 2024 |
5.06 (-1.75%) |
5.22 |
4.77 - 5.69 |
0.6967 times |
Tue 26 November 2024 |
5.15 (9.81%) |
4.72 |
4.60 - 5.80 |
0.8095 times |
Thu 31 October 2024 |
4.69 (-16.55%) |
5.63 |
4.66 - 5.91 |
1.1337 times |
DMA SMA EMA moving averages of Tegna Inc GCI
DMA (daily moving average) of Tegna Inc GCI
| DMA period | DMA value | | 5 day DMA | 3.77 | | 12 day DMA | 3.71 | | 20 day DMA | 3.73 | | 35 day DMA | 3.64 | | 50 day DMA | 3.6 | | 100 day DMA | 3.39 | | 150 day DMA | 3.8 | | 200 day DMA | 4.18 | EMA (exponential moving average) of Tegna Inc GCI
| EMA period | EMA current | EMA prev | EMA prev2 | | 5 day EMA | 3.82 | 3.72 | 3.68 | | 12 day EMA | 3.75 | 3.7 | 3.68 | | 20 day EMA | 3.71 | 3.68 | 3.67 | | 35 day EMA | 3.67 | 3.65 | 3.64 | | 50 day EMA | 3.62 | 3.6 | 3.59 |
SMA (simple moving average) of Tegna Inc GCI
| SMA period | SMA current | SMA prev | SMA prev2 | | 5 day SMA | 3.77 | 3.71 | 3.68 | | 12 day SMA | 3.71 | 3.68 | 3.66 | | 20 day SMA | 3.73 | 3.72 | 3.72 | | 35 day SMA | 3.64 | 3.63 | 3.62 | | 50 day SMA | 3.6 | 3.59 | 3.58 | | 100 day SMA | 3.39 | 3.38 | 3.38 | | 150 day SMA | 3.8 | 3.81 | 3.82 | | 200 day SMA | 4.18 | 4.19 | 4.2 |
|
|
