GreeneCounty GCBC full analysis,charts,indicators,moving averages,SMA,DMA,EMA,ADX,MACD,RSIGreene County GCBC WideScreen charts, DMA,SMA,EMA technical analysis, forecast prediction, by indicators ADX,MACD,RSI,CCI USA stock exchange
operates under Finance sector & deals in Banks
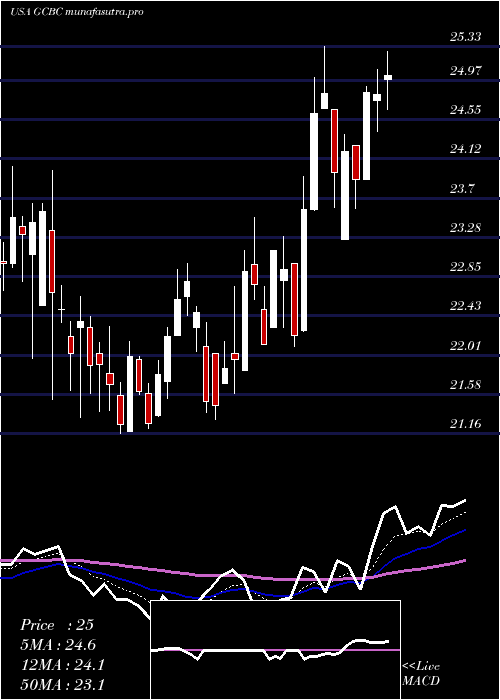
Daily price and charts and targets GreeneCounty Strong Daily Stock price targets for GreeneCounty GCBC are 22.89 and 23.58 | Daily Target 1 | 22.34 | | Daily Target 2 | 22.74 | | Daily Target 3 | 23.026666666667 | | Daily Target 4 | 23.43 | | Daily Target 5 | 23.72 |
Daily price and volume Greene County
| Date |
Closing |
Open |
Range |
Volume |
Thu 04 December 2025 |
23.15 (0.65%) |
23.06 |
22.62 - 23.31 |
1.6305 times |
Wed 03 December 2025 |
23.00 (3.6%) |
22.40 |
22.40 - 23.44 |
0.9665 times |
Tue 02 December 2025 |
22.20 (-2.2%) |
22.92 |
22.20 - 22.92 |
0.881 times |
Mon 01 December 2025 |
22.70 (-0.44%) |
22.45 |
22.45 - 23.42 |
1.9461 times |
Fri 28 November 2025 |
22.80 (0.93%) |
22.85 |
22.39 - 22.88 |
0.2433 times |
Wed 26 November 2025 |
22.59 (-1.61%) |
22.68 |
22.35 - 22.96 |
0.6312 times |
Tue 25 November 2025 |
22.96 (4.17%) |
22.20 |
22.01 - 22.96 |
0.6114 times |
Mon 24 November 2025 |
22.04 (-4.01%) |
22.51 |
21.94 - 22.82 |
1.499 times |
Fri 21 November 2025 |
22.96 (6.25%) |
21.74 |
21.51 - 22.96 |
1.0125 times |
Thu 20 November 2025 |
21.61 (-2.13%) |
22.15 |
21.53 - 22.30 |
0.5786 times |
Wed 19 November 2025 |
22.08 (0.59%) |
21.95 |
21.94 - 22.29 |
0.5983 times |
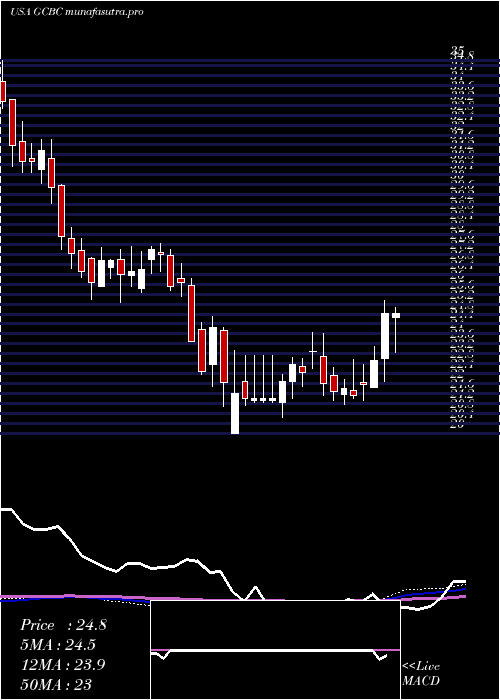
Weekly price and charts GreeneCounty Strong weekly Stock price targets for GreeneCounty GCBC are 22.68 and 23.92 | Weekly Target 1 | 21.69 | | Weekly Target 2 | 22.42 | | Weekly Target 3 | 22.93 | | Weekly Target 4 | 23.66 | | Weekly Target 5 | 24.17 |
Weekly price and volumes for Greene County
| Date |
Closing |
Open |
Range |
Volume |
Thu 04 December 2025 |
23.15 (1.54%) |
22.45 |
22.20 - 23.44 |
1.6094 times |
Fri 28 November 2025 |
22.80 (-0.7%) |
22.51 |
21.94 - 22.96 |
0.8857 times |
Fri 21 November 2025 |
22.96 (3.47%) |
22.03 |
21.51 - 22.96 |
1.0222 times |
Fri 14 November 2025 |
22.19 (-1.16%) |
22.50 |
21.96 - 22.94 |
0.6184 times |
Fri 07 November 2025 |
22.45 (2.28%) |
22.02 |
21.79 - 22.81 |
0.6847 times |
Fri 31 October 2025 |
21.95 (0%) |
22.03 |
21.75 - 22.29 |
0.2243 times |
Fri 31 October 2025 |
21.95 (-3.98%) |
22.98 |
21.75 - 23.27 |
1.1159 times |
Fri 24 October 2025 |
22.86 (4.48%) |
22.18 |
21.63 - 24.46 |
0.8 times |
Fri 17 October 2025 |
21.88 (1.77%) |
22.01 |
21.25 - 23.22 |
1.3812 times |
Fri 10 October 2025 |
21.50 (-2.45%) |
22.46 |
21.50 - 23.37 |
1.6582 times |
Fri 03 October 2025 |
22.04 (-3.84%) |
23.00 |
21.41 - 23.00 |
2.3512 times |
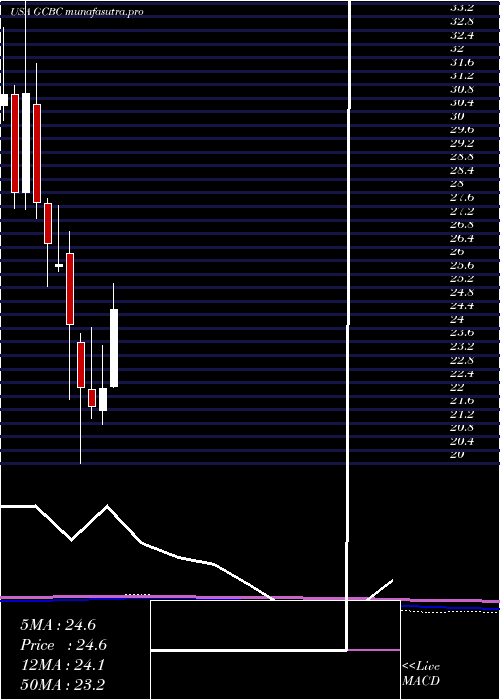
Monthly price and charts GreeneCounty Strong monthly Stock price targets for GreeneCounty GCBC are 22.68 and 23.92 | Monthly Target 1 | 21.69 | | Monthly Target 2 | 22.42 | | Monthly Target 3 | 22.93 | | Monthly Target 4 | 23.66 | | Monthly Target 5 | 24.17 |
Monthly price and volumes Greene County
| Date |
Closing |
Open |
Range |
Volume |
Thu 04 December 2025 |
23.15 (1.54%) |
22.45 |
22.20 - 23.44 |
0.1815 times |
Fri 28 November 2025 |
22.80 (3.87%) |
22.02 |
21.51 - 22.96 |
0.3621 times |
Fri 31 October 2025 |
21.95 (-2.88%) |
22.71 |
21.25 - 24.46 |
0.7557 times |
Tue 30 September 2025 |
22.60 (-5.79%) |
24.11 |
22.03 - 24.73 |
0.6005 times |
Fri 29 August 2025 |
23.99 (1.27%) |
23.57 |
22.58 - 25.20 |
0.5066 times |
Thu 31 July 2025 |
23.69 (6.62%) |
22.27 |
22.26 - 26.04 |
1.729 times |
Mon 30 June 2025 |
22.22 (2.44%) |
21.57 |
21.16 - 23.49 |
0.9839 times |
Fri 30 May 2025 |
21.69 (-2.52%) |
22.20 |
21.34 - 24.04 |
1.2895 times |
Wed 30 April 2025 |
22.25 (-7.71%) |
23.59 |
20.00 - 23.85 |
1.5166 times |
Mon 31 March 2025 |
24.11 (-6.91%) |
26.21 |
21.90 - 26.85 |
2.0746 times |
Fri 28 February 2025 |
25.90 (-2.26%) |
25.83 |
25.67 - 27.62 |
0.7367 times |
DMA SMA EMA moving averages of Greene County GCBC
DMA (daily moving average) of Greene County GCBC
| DMA period | DMA value | | 5 day DMA | 22.77 | | 12 day DMA | 22.5 | | 20 day DMA | 22.43 | | 35 day DMA | 22.33 | | 50 day DMA | 22.36 | | 100 day DMA | 23.19 | | 150 day DMA | 23.06 | | 200 day DMA | 23.21 | EMA (exponential moving average) of Greene County GCBC
| EMA period | EMA current | EMA prev | EMA prev2 | | 5 day EMA | 22.82 | 22.66 | 22.49 | | 12 day EMA | 22.61 | 22.51 | 22.42 | | 20 day EMA | 22.52 | 22.45 | 22.39 | | 35 day EMA | 22.51 | 22.47 | 22.44 | | 50 day EMA | 22.53 | 22.5 | 22.48 |
SMA (simple moving average) of Greene County GCBC
| SMA period | SMA current | SMA prev | SMA prev2 | | 5 day SMA | 22.77 | 22.66 | 22.65 | | 12 day SMA | 22.5 | 22.38 | 22.31 | | 20 day SMA | 22.43 | 22.41 | 22.37 | | 35 day SMA | 22.33 | 22.29 | 22.28 | | 50 day SMA | 22.36 | 22.36 | 22.37 | | 100 day SMA | 23.19 | 23.21 | 23.23 | | 150 day SMA | 23.06 | 23.06 | 23.05 | | 200 day SMA | 23.21 | 23.23 | 23.25 |
|
|
