GlacierBancorp GBCI full analysis,charts,indicators,moving averages,SMA,DMA,EMA,ADX,MACD,RSIGlacier Bancorp GBCI WideScreen charts, DMA,SMA,EMA technical analysis, forecast prediction, by indicators ADX,MACD,RSI,CCI USA stock exchange
operates under Finance sector & deals in Major Banks
Daily price and charts and targets GlacierBancorp Strong Daily Stock price targets for GlacierBancorp GBCI are 42.59 and 43.21 | Daily Target 1 | 42.1 | | Daily Target 2 | 42.45 | | Daily Target 3 | 42.723333333333 | | Daily Target 4 | 43.07 | | Daily Target 5 | 43.34 |
Daily price and volume Glacier Bancorp
| Date |
Closing |
Open |
Range |
Volume |
Thu 04 December 2025 |
42.79 (0.21%) |
42.52 |
42.38 - 43.00 |
1.0577 times |
Wed 03 December 2025 |
42.70 (0.38%) |
42.73 |
42.30 - 43.11 |
1.4357 times |
Tue 02 December 2025 |
42.54 (-1.12%) |
43.24 |
42.50 - 43.34 |
0.8533 times |
Mon 01 December 2025 |
43.02 (1.7%) |
41.93 |
41.93 - 43.38 |
0.9145 times |
Fri 28 November 2025 |
42.30 (-0.84%) |
42.59 |
42.16 - 42.88 |
0.4558 times |
Wed 26 November 2025 |
42.66 (-1.34%) |
42.89 |
42.62 - 43.38 |
0.9841 times |
Tue 25 November 2025 |
43.24 (3.25%) |
42.00 |
42.00 - 43.44 |
1.1444 times |
Mon 24 November 2025 |
41.88 (-0.73%) |
41.91 |
41.44 - 42.26 |
1.1173 times |
Fri 21 November 2025 |
42.19 (4.4%) |
40.69 |
40.48 - 42.54 |
1.127 times |
Thu 20 November 2025 |
40.41 (-0.49%) |
41.23 |
40.16 - 41.65 |
0.9102 times |
Wed 19 November 2025 |
40.61 (0.89%) |
40.40 |
39.97 - 40.90 |
0.8214 times |
Weekly price and charts GlacierBancorp Strong weekly Stock price targets for GlacierBancorp GBCI are 42.36 and 43.81 | Weekly Target 1 | 41.25 | | Weekly Target 2 | 42.02 | | Weekly Target 3 | 42.7 | | Weekly Target 4 | 43.47 | | Weekly Target 5 | 44.15 |
Weekly price and volumes for Glacier Bancorp
| Date |
Closing |
Open |
Range |
Volume |
Thu 04 December 2025 |
42.79 (1.16%) |
41.93 |
41.93 - 43.38 |
0.6893 times |
Fri 28 November 2025 |
42.30 (0.26%) |
41.91 |
41.44 - 43.44 |
0.5988 times |
Fri 21 November 2025 |
42.19 (-0.35%) |
42.30 |
39.90 - 42.54 |
0.8613 times |
Fri 14 November 2025 |
42.34 (-0.61%) |
42.84 |
40.86 - 43.66 |
0.9655 times |
Fri 07 November 2025 |
42.60 (4.28%) |
40.20 |
39.97 - 42.66 |
1.0665 times |
Fri 31 October 2025 |
40.85 (0%) |
40.28 |
39.93 - 41.42 |
0.394 times |
Fri 31 October 2025 |
40.85 (-6.84%) |
44.11 |
39.93 - 44.46 |
1.3394 times |
Fri 24 October 2025 |
43.85 (-0.2%) |
44.40 |
42.78 - 44.45 |
1.2965 times |
Fri 17 October 2025 |
43.94 (-4.89%) |
46.81 |
42.92 - 49.56 |
1.7846 times |
Fri 10 October 2025 |
46.20 (-4.13%) |
48.74 |
46.05 - 49.39 |
1.0042 times |
Fri 03 October 2025 |
48.19 (-3.45%) |
49.99 |
46.91 - 49.99 |
1.7752 times |

Monthly price and charts GlacierBancorp Strong monthly Stock price targets for GlacierBancorp GBCI are 42.36 and 43.81 | Monthly Target 1 | 41.25 | | Monthly Target 2 | 42.02 | | Monthly Target 3 | 42.7 | | Monthly Target 4 | 43.47 | | Monthly Target 5 | 44.15 |
Monthly price and volumes Glacier Bancorp
| Date |
Closing |
Open |
Range |
Volume |
Thu 04 December 2025 |
42.79 (1.16%) |
41.93 |
41.93 - 43.38 |
0.1787 times |
Fri 28 November 2025 |
42.30 (3.55%) |
40.20 |
39.90 - 43.66 |
0.9052 times |
Fri 31 October 2025 |
40.85 (-16.07%) |
48.32 |
39.93 - 49.56 |
1.8283 times |
Tue 30 September 2025 |
48.67 (-0.98%) |
48.28 |
47.04 - 50.54 |
1.0341 times |
Fri 29 August 2025 |
49.15 (12.14%) |
43.00 |
42.08 - 49.47 |
1.099 times |
Thu 31 July 2025 |
43.83 (1.74%) |
42.73 |
42.73 - 47.27 |
1.149 times |
Mon 30 June 2025 |
43.08 (3.88%) |
41.33 |
39.96 - 44.05 |
1.0156 times |
Fri 30 May 2025 |
41.47 (1.74%) |
40.73 |
40.09 - 44.70 |
0.8907 times |
Wed 30 April 2025 |
40.76 (-7.82%) |
43.69 |
36.76 - 44.55 |
0.9327 times |
Mon 31 March 2025 |
44.22 (-9.46%) |
48.92 |
43.18 - 49.73 |
0.9667 times |
Fri 28 February 2025 |
48.84 (-1.67%) |
48.45 |
47.21 - 51.50 |
0.7726 times |

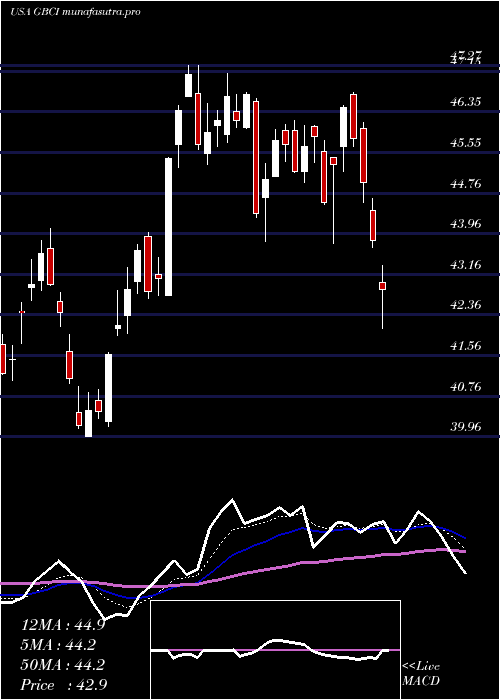
DMA SMA EMA moving averages of Glacier Bancorp GBCI
DMA (daily moving average) of Glacier Bancorp GBCI
| DMA period | DMA value | | 5 day DMA | 42.67 | | 12 day DMA | 42.05 | | 20 day DMA | 42.07 | | 35 day DMA | 42.27 | | 50 day DMA | 44.03 | | 100 day DMA | 45.5 | | 150 day DMA | 44.61 | | 200 day DMA | 44.25 | EMA (exponential moving average) of Glacier Bancorp GBCI
| EMA period | EMA current | EMA prev | EMA prev2 | | 5 day EMA | 42.66 | 42.59 | 42.53 | | 12 day EMA | 42.38 | 42.3 | 42.23 | | 20 day EMA | 42.41 | 42.37 | 42.34 | | 35 day EMA | 43.38 | 43.41 | 43.45 | | 50 day EMA | 44.36 | 44.42 | 44.49 |
SMA (simple moving average) of Glacier Bancorp GBCI
| SMA period | SMA current | SMA prev | SMA prev2 | | 5 day SMA | 42.67 | 42.64 | 42.75 | | 12 day SMA | 42.05 | 41.83 | 41.8 | | 20 day SMA | 42.07 | 42.02 | 41.93 | | 35 day SMA | 42.27 | 42.42 | 42.6 | | 50 day SMA | 44.03 | 44.16 | 44.29 | | 100 day SMA | 45.5 | 45.52 | 45.56 | | 150 day SMA | 44.61 | 44.6 | 44.59 | | 200 day SMA | 44.25 | 44.29 | 44.33 |
|
|
