GuggenheimTaxable GBAB full analysis,charts,indicators,moving averages,SMA,DMA,EMA,ADX,MACD,RSIGuggenheim Taxable GBAB WideScreen charts, DMA,SMA,EMA technical analysis, forecast prediction, by indicators ADX,MACD,RSI,CCI USA stock exchange
operates under N A sector & deals in N A
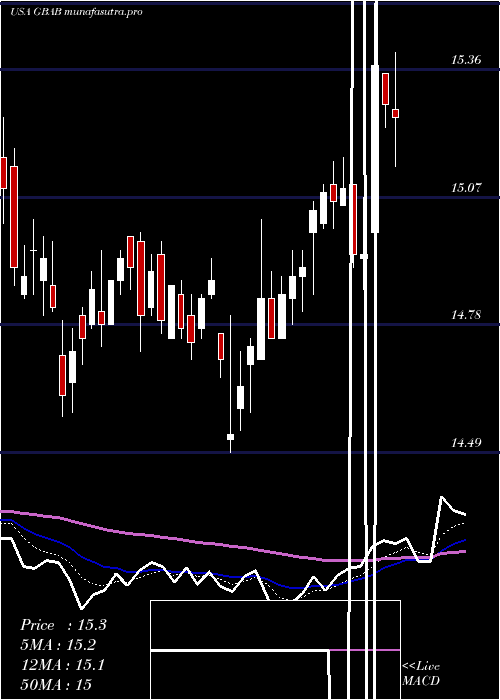
Daily price and charts and targets GuggenheimTaxable Strong Daily Stock price targets for GuggenheimTaxable GBAB are 15.36 and 15.48 | Daily Target 1 | 15.33 | | Daily Target 2 | 15.39 | | Daily Target 3 | 15.453333333333 | | Daily Target 4 | 15.51 | | Daily Target 5 | 15.57 |
Daily price and volume Guggenheim Taxable
| Date |
Closing |
Open |
Range |
Volume |
Thu 04 December 2025 |
15.44 (-0.45%) |
15.51 |
15.40 - 15.52 |
0.4059 times |
Wed 03 December 2025 |
15.51 (0.98%) |
15.41 |
15.34 - 15.53 |
1.2409 times |
Tue 02 December 2025 |
15.36 (0.07%) |
15.40 |
15.29 - 15.40 |
0.646 times |
Mon 01 December 2025 |
15.35 (0.13%) |
15.29 |
15.21 - 15.41 |
1.559 times |
Fri 28 November 2025 |
15.33 (0.39%) |
15.33 |
15.28 - 15.37 |
0.5034 times |
Wed 26 November 2025 |
15.27 (0.86%) |
15.19 |
15.19 - 15.28 |
0.5741 times |
Tue 25 November 2025 |
15.14 (0.13%) |
15.13 |
15.12 - 15.29 |
0.5985 times |
Mon 24 November 2025 |
15.12 (1.07%) |
15.05 |
15.05 - 15.18 |
0.5826 times |
Fri 21 November 2025 |
14.96 (0.2%) |
14.93 |
14.78 - 15.07 |
1.108 times |
Thu 20 November 2025 |
14.93 (-1.58%) |
15.17 |
14.89 - 15.19 |
2.7816 times |
Wed 19 November 2025 |
15.17 (-0.78%) |
15.28 |
15.08 - 15.34 |
2.0173 times |
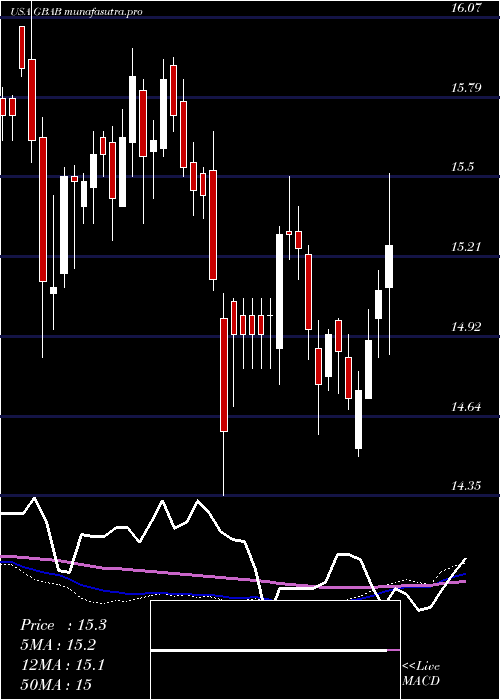
Weekly price and charts GuggenheimTaxable Strong weekly Stock price targets for GuggenheimTaxable GBAB are 15.33 and 15.65 | Weekly Target 1 | 15.07 | | Weekly Target 2 | 15.26 | | Weekly Target 3 | 15.393333333333 | | Weekly Target 4 | 15.58 | | Weekly Target 5 | 15.71 |
Weekly price and volumes for Guggenheim Taxable
| Date |
Closing |
Open |
Range |
Volume |
Thu 04 December 2025 |
15.44 (0.72%) |
15.29 |
15.21 - 15.53 |
1.1034 times |
Fri 28 November 2025 |
15.33 (2.47%) |
15.05 |
15.05 - 15.37 |
0.647 times |
Fri 21 November 2025 |
14.96 (-3.3%) |
15.47 |
14.78 - 15.54 |
2.1404 times |
Fri 14 November 2025 |
15.47 (-0.06%) |
15.47 |
15.41 - 15.73 |
1.0014 times |
Fri 07 November 2025 |
15.48 (-1.34%) |
15.68 |
15.40 - 15.68 |
0.5918 times |
Fri 31 October 2025 |
15.69 (0%) |
15.77 |
15.59 - 15.77 |
0.2828 times |
Fri 31 October 2025 |
15.69 (0.58%) |
15.64 |
15.55 - 15.80 |
1.1561 times |
Fri 24 October 2025 |
15.60 (1.89%) |
15.31 |
15.21 - 15.70 |
1.3953 times |
Fri 17 October 2025 |
15.31 (-2.3%) |
15.59 |
15.21 - 15.69 |
1.206 times |
Tue 07 October 2025 |
15.67 (0.26%) |
15.52 |
15.49 - 15.74 |
0.4757 times |
Fri 03 October 2025 |
15.63 (2.36%) |
15.38 |
15.27 - 15.70 |
1.2955 times |
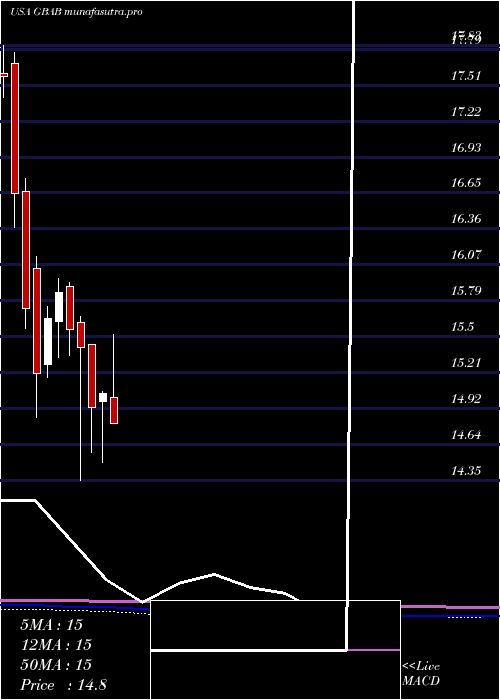
Monthly price and charts GuggenheimTaxable Strong monthly Stock price targets for GuggenheimTaxable GBAB are 15.33 and 15.65 | Monthly Target 1 | 15.07 | | Monthly Target 2 | 15.26 | | Monthly Target 3 | 15.393333333333 | | Monthly Target 4 | 15.58 | | Monthly Target 5 | 15.71 |
Monthly price and volumes Guggenheim Taxable
| Date |
Closing |
Open |
Range |
Volume |
Thu 04 December 2025 |
15.44 (0.72%) |
15.29 |
15.21 - 15.53 |
0.1982 times |
Fri 28 November 2025 |
15.33 (-2.29%) |
15.68 |
14.78 - 15.73 |
0.787 times |
Fri 31 October 2025 |
15.69 (0.71%) |
15.50 |
15.21 - 15.80 |
0.9394 times |
Tue 30 September 2025 |
15.58 (0.06%) |
15.47 |
15.18 - 15.94 |
1.2101 times |
Fri 29 August 2025 |
15.57 (3.18%) |
15.13 |
15.00 - 15.57 |
1.0738 times |
Thu 31 July 2025 |
15.09 (0.33%) |
15.01 |
14.79 - 15.51 |
1.3072 times |
Mon 30 June 2025 |
15.04 (0.74%) |
14.98 |
14.49 - 15.06 |
1.3702 times |
Fri 30 May 2025 |
14.93 (-3.11%) |
15.43 |
14.57 - 15.43 |
0.929 times |
Wed 30 April 2025 |
15.41 (-0.9%) |
15.61 |
14.35 - 15.66 |
1.2851 times |
Mon 31 March 2025 |
15.55 (-1.89%) |
15.90 |
15.35 - 15.93 |
0.9 times |
Fri 28 February 2025 |
15.85 (1.34%) |
15.62 |
15.33 - 15.96 |
1.4358 times |
DMA SMA EMA moving averages of Guggenheim Taxable GBAB
DMA (daily moving average) of Guggenheim Taxable GBAB
| DMA period | DMA value | | 5 day DMA | 15.4 | | 12 day DMA | 15.24 | | 20 day DMA | 15.35 | | 35 day DMA | 15.44 | | 50 day DMA | 15.45 | | 100 day DMA | 15.37 | | 150 day DMA | 15.24 | | 200 day DMA | 15.27 | EMA (exponential moving average) of Guggenheim Taxable GBAB
| EMA period | EMA current | EMA prev | EMA prev2 | | 5 day EMA | 15.39 | 15.37 | 15.3 | | 12 day EMA | 15.34 | 15.32 | 15.28 | | 20 day EMA | 15.36 | 15.35 | 15.33 | | 35 day EMA | 15.39 | 15.39 | 15.38 | | 50 day EMA | 15.45 | 15.45 | 15.45 |
SMA (simple moving average) of Guggenheim Taxable GBAB
| SMA period | SMA current | SMA prev | SMA prev2 | | 5 day SMA | 15.4 | 15.36 | 15.29 | | 12 day SMA | 15.24 | 15.23 | 15.23 | | 20 day SMA | 15.35 | 15.35 | 15.35 | | 35 day SMA | 15.44 | 15.44 | 15.43 | | 50 day SMA | 15.45 | 15.45 | 15.44 | | 100 day SMA | 15.37 | 15.37 | 15.37 | | 150 day SMA | 15.24 | 15.24 | 15.23 | | 200 day SMA | 15.27 | 15.27 | 15.27 |
|
|
