GatxCorporation GATX full analysis,charts,indicators,moving averages,SMA,DMA,EMA,ADX,MACD,RSIGatx Corporation GATX WideScreen charts, DMA,SMA,EMA technical analysis, forecast prediction, by indicators ADX,MACD,RSI,CCI USA stock exchange
operates under Consumer Services sector & deals in Transportation Services
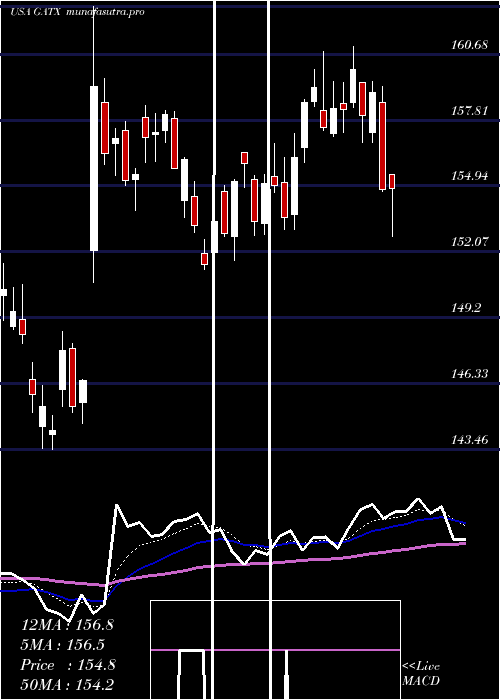
Daily price and charts and targets GatxCorporation Strong Daily Stock price targets for GatxCorporation GATX are 163.58 and 165.7 | Daily Target 1 | 163.18 | | Daily Target 2 | 163.98 | | Daily Target 3 | 165.3 | | Daily Target 4 | 166.1 | | Daily Target 5 | 167.42 |
Daily price and volume Gatx Corporation
| Date |
Closing |
Open |
Range |
Volume |
Thu 04 December 2025 |
164.78 (-0.54%) |
166.00 |
164.50 - 166.62 |
0.8304 times |
Wed 03 December 2025 |
165.68 (2.91%) |
161.93 |
159.72 - 165.77 |
0.855 times |
Tue 02 December 2025 |
161.00 (0.85%) |
160.93 |
159.12 - 161.30 |
1.1108 times |
Mon 01 December 2025 |
159.65 (-0.18%) |
158.83 |
158.83 - 161.14 |
0.891 times |
Fri 28 November 2025 |
159.93 (-0.24%) |
160.73 |
159.50 - 161.37 |
0.6151 times |
Wed 26 November 2025 |
160.32 (0.57%) |
158.84 |
157.67 - 161.72 |
1.1329 times |
Tue 25 November 2025 |
159.41 (1.81%) |
157.23 |
156.24 - 159.59 |
0.8998 times |
Mon 24 November 2025 |
156.58 (-0.27%) |
157.60 |
154.38 - 157.60 |
1.3495 times |
Fri 21 November 2025 |
157.01 (1.96%) |
155.16 |
153.72 - 159.40 |
1.2099 times |
Thu 20 November 2025 |
153.99 (1%) |
154.50 |
152.74 - 155.90 |
1.1057 times |
Wed 19 November 2025 |
152.47 (-0.2%) |
152.79 |
151.87 - 154.19 |
0.9542 times |
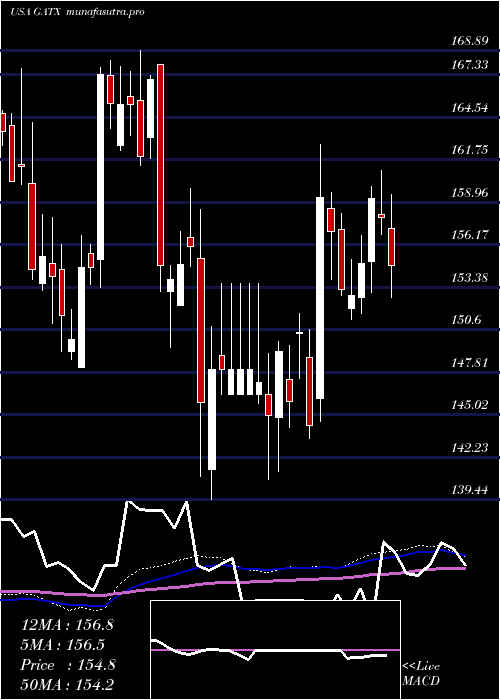
Weekly price and charts GatxCorporation Strong weekly Stock price targets for GatxCorporation GATX are 161.81 and 169.6 | Weekly Target 1 | 155.62 | | Weekly Target 2 | 160.2 | | Weekly Target 3 | 163.41 | | Weekly Target 4 | 167.99 | | Weekly Target 5 | 171.2 |
Weekly price and volumes for Gatx Corporation
| Date |
Closing |
Open |
Range |
Volume |
Thu 04 December 2025 |
164.78 (3.03%) |
158.83 |
158.83 - 166.62 |
0.7825 times |
Fri 28 November 2025 |
159.93 (1.86%) |
157.60 |
154.38 - 161.72 |
0.8483 times |
Fri 21 November 2025 |
157.01 (-0.15%) |
157.57 |
150.69 - 159.40 |
1.1918 times |
Fri 14 November 2025 |
157.25 (1.4%) |
155.66 |
153.13 - 158.65 |
1.0783 times |
Fri 07 November 2025 |
155.08 (-1.13%) |
154.85 |
150.42 - 156.00 |
1.3539 times |
Fri 31 October 2025 |
156.85 (0%) |
157.70 |
155.67 - 159.36 |
0.2402 times |
Fri 31 October 2025 |
156.85 (-2.7%) |
162.66 |
155.67 - 163.16 |
1.2062 times |
Fri 24 October 2025 |
161.21 (-6.28%) |
172.82 |
160.19 - 174.31 |
1.581 times |
Fri 17 October 2025 |
172.02 (1.7%) |
169.72 |
168.64 - 176.91 |
0.9702 times |
Fri 10 October 2025 |
169.15 (-3.81%) |
176.40 |
169.14 - 177.42 |
0.7475 times |
Fri 03 October 2025 |
175.85 (-0.63%) |
176.95 |
172.43 - 177.02 |
0.9107 times |
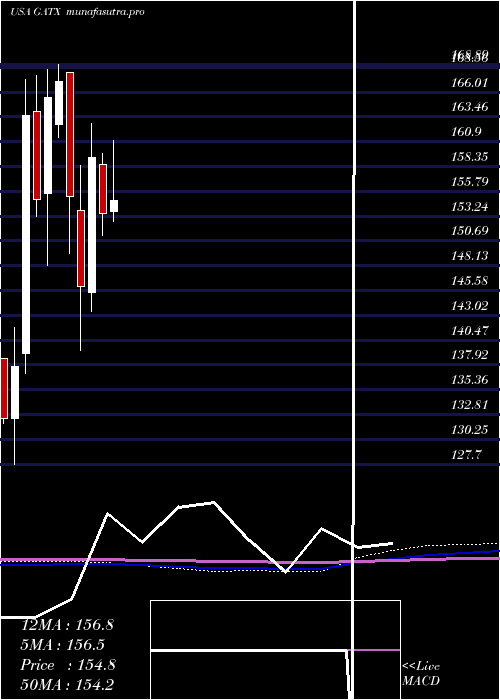
Monthly price and charts GatxCorporation Strong monthly Stock price targets for GatxCorporation GATX are 161.81 and 169.6 | Monthly Target 1 | 155.62 | | Monthly Target 2 | 160.2 | | Monthly Target 3 | 163.41 | | Monthly Target 4 | 167.99 | | Monthly Target 5 | 171.2 |
Monthly price and volumes Gatx Corporation
| Date |
Closing |
Open |
Range |
Volume |
Thu 04 December 2025 |
164.78 (3.03%) |
158.83 |
158.83 - 166.62 |
0.1665 times |
Fri 28 November 2025 |
159.93 (1.96%) |
154.85 |
150.42 - 161.72 |
0.9517 times |
Fri 31 October 2025 |
156.85 (-10.27%) |
174.49 |
155.67 - 177.42 |
1.1041 times |
Tue 30 September 2025 |
174.80 (3.86%) |
167.00 |
165.50 - 178.26 |
1.2691 times |
Fri 29 August 2025 |
168.31 (10.23%) |
151.22 |
148.26 - 171.62 |
0.9925 times |
Thu 31 July 2025 |
152.69 (-0.57%) |
153.68 |
151.61 - 161.03 |
1.0767 times |
Mon 30 June 2025 |
153.56 (-3.57%) |
158.54 |
151.29 - 159.63 |
1.0386 times |
Fri 30 May 2025 |
159.24 (9.1%) |
145.42 |
143.46 - 162.76 |
1.2156 times |
Wed 30 April 2025 |
145.96 (-6%) |
153.83 |
139.44 - 158.47 |
1.3288 times |
Mon 31 March 2025 |
155.27 (-7.05%) |
168.00 |
149.41 - 168.00 |
0.8565 times |
Fri 28 February 2025 |
167.05 (0.95%) |
162.66 |
161.35 - 168.89 |
0.6546 times |
DMA SMA EMA moving averages of Gatx Corporation GATX
DMA (daily moving average) of Gatx Corporation GATX
| DMA period | DMA value | | 5 day DMA | 162.21 | | 12 day DMA | 158.63 | | 20 day DMA | 157.39 | | 35 day DMA | 159.19 | | 50 day DMA | 163.67 | | 100 day DMA | 162.73 | | 150 day DMA | 159.35 | | 200 day DMA | 157.72 | EMA (exponential moving average) of Gatx Corporation GATX
| EMA period | EMA current | EMA prev | EMA prev2 | | 5 day EMA | 162.69 | 161.65 | 159.64 | | 12 day EMA | 160.17 | 159.33 | 158.18 | | 20 day EMA | 159.56 | 159.01 | 158.31 | | 35 day EMA | 161.68 | 161.5 | 161.25 | | 50 day EMA | 164.41 | 164.39 | 164.34 |
SMA (simple moving average) of Gatx Corporation GATX
| SMA period | SMA current | SMA prev | SMA prev2 | | 5 day SMA | 162.21 | 161.32 | 160.06 | | 12 day SMA | 158.63 | 157.63 | 156.92 | | 20 day SMA | 157.39 | 156.8 | 156.12 | | 35 day SMA | 159.19 | 159.51 | 159.75 | | 50 day SMA | 163.67 | 163.85 | 164.07 | | 100 day SMA | 162.73 | 162.63 | 162.56 | | 150 day SMA | 159.35 | 159.23 | 159.09 | | 200 day SMA | 157.72 | 157.73 | 157.74 |
|
|
