GeneralAmerican GAM full analysis,charts,indicators,moving averages,SMA,DMA,EMA,ADX,MACD,RSIGeneral American GAM WideScreen charts, DMA,SMA,EMA technical analysis, forecast prediction, by indicators ADX,MACD,RSI,CCI USA stock exchange
operates under N A sector & deals in N A
Daily price and charts and targets GeneralAmerican Strong Daily Stock price targets for GeneralAmerican GAM are 58.82 and 59.2 | Daily Target 1 | 58.53 | | Daily Target 2 | 58.72 | | Daily Target 3 | 58.906666666667 | | Daily Target 4 | 59.1 | | Daily Target 5 | 59.29 |
Daily price and volume General American
| Date |
Closing |
Open |
Range |
Volume |
Thu 04 December 2025 |
58.92 (0.05%) |
58.73 |
58.71 - 59.09 |
0.5221 times |
Wed 03 December 2025 |
58.89 (0.41%) |
58.53 |
58.29 - 58.89 |
0.9198 times |
Tue 02 December 2025 |
58.65 (0.43%) |
58.47 |
58.47 - 58.82 |
0.7769 times |
Mon 01 December 2025 |
58.40 (-0.58%) |
58.73 |
58.40 - 59.33 |
0.665 times |
Fri 28 November 2025 |
58.74 (1.24%) |
58.39 |
58.39 - 59.10 |
0.3232 times |
Wed 26 November 2025 |
58.02 (0.35%) |
57.52 |
57.52 - 58.62 |
0.9944 times |
Tue 25 November 2025 |
57.82 (0.64%) |
57.59 |
57.11 - 57.96 |
1.3549 times |
Mon 24 November 2025 |
57.45 (1.57%) |
56.82 |
56.46 - 57.45 |
1.5538 times |
Fri 21 November 2025 |
56.56 (-0.19%) |
56.76 |
56.33 - 57.18 |
1.2989 times |
Thu 20 November 2025 |
56.67 (-0.6%) |
57.59 |
56.67 - 58.22 |
1.5911 times |
Wed 19 November 2025 |
57.01 (0.53%) |
56.79 |
56.79 - 57.33 |
1.0814 times |
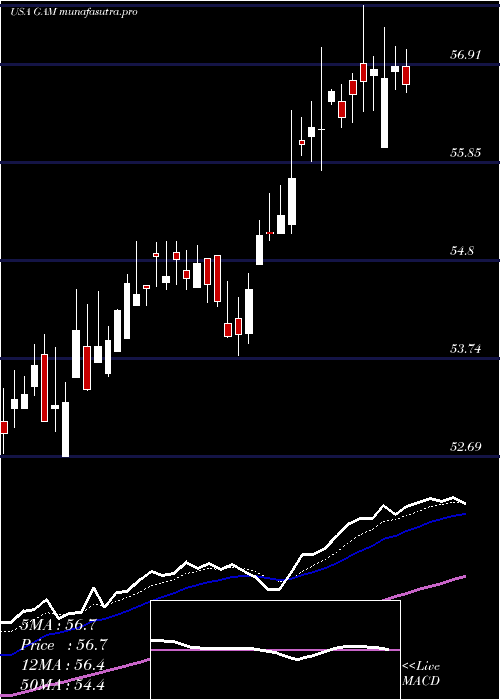
Weekly price and charts GeneralAmerican Strong weekly Stock price targets for GeneralAmerican GAM are 58.61 and 59.65 | Weekly Target 1 | 57.81 | | Weekly Target 2 | 58.36 | | Weekly Target 3 | 58.846666666667 | | Weekly Target 4 | 59.4 | | Weekly Target 5 | 59.89 |
Weekly price and volumes for General American
| Date |
Closing |
Open |
Range |
Volume |
Thu 04 December 2025 |
58.92 (0.31%) |
58.73 |
58.29 - 59.33 |
0.5873 times |
Fri 28 November 2025 |
58.74 (3.85%) |
56.82 |
56.46 - 59.10 |
0.8607 times |
Fri 21 November 2025 |
56.56 (-11.08%) |
58.75 |
56.24 - 58.77 |
1.7354 times |
Fri 14 November 2025 |
63.61 (1.31%) |
63.08 |
62.92 - 64.40 |
1.4886 times |
Fri 07 November 2025 |
62.79 (-1.51%) |
63.01 |
62.31 - 64.00 |
0.743 times |
Fri 31 October 2025 |
63.75 (0%) |
64.00 |
63.14 - 64.00 |
0.0785 times |
Fri 31 October 2025 |
63.75 (1.17%) |
63.21 |
63.01 - 64.00 |
1.2557 times |
Fri 24 October 2025 |
63.01 (1.37%) |
62.21 |
62.21 - 63.99 |
0.7354 times |
Fri 17 October 2025 |
62.16 (-1.33%) |
63.75 |
62.13 - 64.27 |
1.3481 times |
Fri 10 October 2025 |
63.00 (0.25%) |
62.70 |
62.70 - 64.13 |
1.1673 times |
Fri 03 October 2025 |
62.84 (1.88%) |
62.25 |
61.56 - 63.19 |
0.6986 times |
Monthly price and charts GeneralAmerican Strong monthly Stock price targets for GeneralAmerican GAM are 58.61 and 59.65 | Monthly Target 1 | 57.81 | | Monthly Target 2 | 58.36 | | Monthly Target 3 | 58.846666666667 | | Monthly Target 4 | 59.4 | | Monthly Target 5 | 59.89 |
Monthly price and volumes General American
| Date |
Closing |
Open |
Range |
Volume |
Thu 04 December 2025 |
58.92 (0.31%) |
58.73 |
58.29 - 59.33 |
0.1275 times |
Fri 28 November 2025 |
58.74 (-7.86%) |
63.01 |
56.24 - 64.40 |
1.0476 times |
Fri 31 October 2025 |
63.75 (2.48%) |
61.56 |
61.56 - 64.27 |
1.0776 times |
Tue 30 September 2025 |
62.21 (3.51%) |
59.66 |
59.63 - 62.84 |
0.6609 times |
Fri 29 August 2025 |
60.10 (5.13%) |
56.27 |
56.27 - 60.51 |
1.1465 times |
Thu 31 July 2025 |
57.17 (2.02%) |
56.13 |
55.76 - 58.19 |
1.3544 times |
Mon 30 June 2025 |
56.04 (3.91%) |
53.82 |
53.78 - 56.41 |
0.7958 times |
Fri 30 May 2025 |
53.93 (6.67%) |
50.87 |
50.87 - 54.48 |
1.0699 times |
Wed 30 April 2025 |
50.56 (0.38%) |
50.47 |
41.80 - 51.25 |
1.156 times |
Mon 31 March 2025 |
50.37 (-1.02%) |
51.44 |
49.16 - 51.89 |
1.5639 times |
Fri 28 February 2025 |
50.89 (-3.51%) |
52.07 |
50.81 - 53.00 |
1.5668 times |
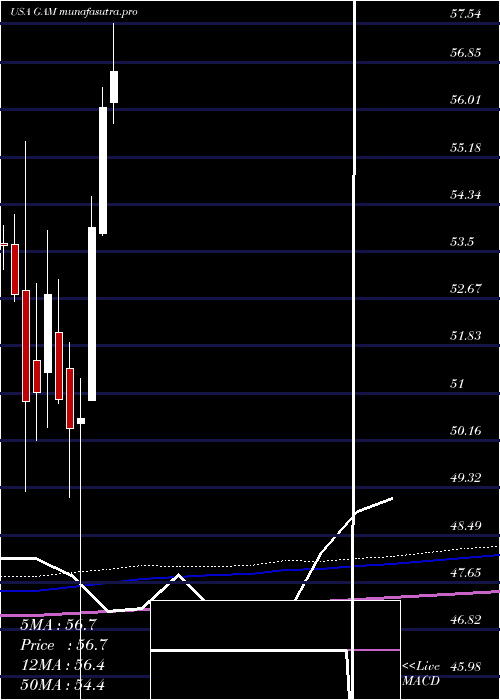
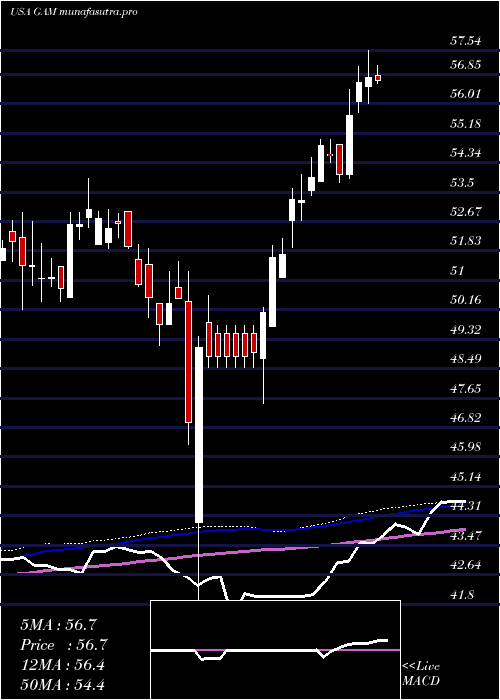
DMA SMA EMA moving averages of General American GAM
DMA (daily moving average) of General American GAM
| DMA period | DMA value | | 5 day DMA | 58.72 | | 12 day DMA | 57.82 | | 20 day DMA | 59.71 | | 35 day DMA | 61.14 | | 50 day DMA | 61.59 | | 100 day DMA | 60.41 | | 150 day DMA | 58.36 | | 200 day DMA | 56.21 | EMA (exponential moving average) of General American GAM
| EMA period | EMA current | EMA prev | EMA prev2 | | 5 day EMA | 58.65 | 58.52 | 58.34 | | 12 day EMA | 58.83 | 58.81 | 58.79 | | 20 day EMA | 59.45 | 59.51 | 59.58 | | 35 day EMA | 60.29 | 60.37 | 60.46 | | 50 day EMA | 61.33 | 61.43 | 61.53 |
SMA (simple moving average) of General American GAM
| SMA period | SMA current | SMA prev | SMA prev2 | | 5 day SMA | 58.72 | 58.54 | 58.33 | | 12 day SMA | 57.82 | 57.65 | 58.04 | | 20 day SMA | 59.71 | 59.91 | 60.12 | | 35 day SMA | 61.14 | 61.25 | 61.37 | | 50 day SMA | 61.59 | 61.65 | 61.71 | | 100 day SMA | 60.41 | 60.38 | 60.36 | | 150 day SMA | 58.36 | 58.3 | 58.25 | | 200 day SMA | 56.21 | 56.18 | 56.14 |
|
|
