GladstoneInvestment GAIN full analysis,charts,indicators,moving averages,SMA,DMA,EMA,ADX,MACD,RSIGladstone Investment GAIN WideScreen charts, DMA,SMA,EMA technical analysis, forecast prediction, by indicators ADX,MACD,RSI,CCI USA stock exchange
operates under N A sector & deals in N A
Daily price and charts and targets GladstoneInvestment Strong Daily Stock price targets for GladstoneInvestment GAIN are 13.92 and 14.07 | Daily Target 1 | 13.8 | | Daily Target 2 | 13.89 | | Daily Target 3 | 13.953333333333 | | Daily Target 4 | 14.04 | | Daily Target 5 | 14.1 |
Daily price and volume Gladstone Investment
| Date |
Closing |
Open |
Range |
Volume |
Thu 04 December 2025 |
13.97 (0.22%) |
13.94 |
13.87 - 14.02 |
1.0782 times |
Wed 03 December 2025 |
13.94 (-0.57%) |
14.02 |
13.87 - 14.02 |
0.8602 times |
Tue 02 December 2025 |
14.02 (0.94%) |
13.94 |
13.83 - 14.04 |
1.5033 times |
Mon 01 December 2025 |
13.89 (-0.93%) |
13.97 |
13.86 - 13.98 |
1.0058 times |
Fri 28 November 2025 |
14.02 (0.36%) |
14.03 |
13.93 - 14.03 |
0.6952 times |
Wed 26 November 2025 |
13.97 (0.07%) |
14.00 |
13.92 - 14.04 |
1.3871 times |
Tue 25 November 2025 |
13.96 (1.23%) |
13.84 |
13.84 - 14.01 |
1.036 times |
Mon 24 November 2025 |
13.79 (0.73%) |
13.70 |
13.60 - 13.79 |
0.776 times |
Fri 21 November 2025 |
13.69 (0.59%) |
13.55 |
13.53 - 13.74 |
0.8493 times |
Thu 20 November 2025 |
13.61 (0.22%) |
13.58 |
13.55 - 13.75 |
0.8089 times |
Wed 19 November 2025 |
13.58 (-0.51%) |
13.67 |
13.54 - 13.74 |
1.1573 times |
Weekly price and charts GladstoneInvestment Strong weekly Stock price targets for GladstoneInvestment GAIN are 13.87 and 14.08 | Weekly Target 1 | 13.74 | | Weekly Target 2 | 13.85 | | Weekly Target 3 | 13.946666666667 | | Weekly Target 4 | 14.06 | | Weekly Target 5 | 14.16 |
Weekly price and volumes for Gladstone Investment
| Date |
Closing |
Open |
Range |
Volume |
Thu 04 December 2025 |
13.97 (-0.36%) |
13.97 |
13.83 - 14.04 |
0.9019 times |
Fri 28 November 2025 |
14.02 (2.41%) |
13.70 |
13.60 - 14.04 |
0.7897 times |
Fri 21 November 2025 |
13.69 (-0.58%) |
13.62 |
13.52 - 13.75 |
1.0103 times |
Fri 14 November 2025 |
13.77 (-1.57%) |
14.02 |
13.62 - 14.04 |
0.9673 times |
Fri 07 November 2025 |
13.99 (1.23%) |
13.73 |
13.56 - 14.03 |
0.736 times |
Fri 31 October 2025 |
13.82 (0%) |
13.89 |
13.80 - 14.04 |
0.2688 times |
Fri 31 October 2025 |
13.82 (-1%) |
13.90 |
13.61 - 14.15 |
1.3897 times |
Fri 24 October 2025 |
13.96 (0.43%) |
13.98 |
13.81 - 14.06 |
0.984 times |
Fri 17 October 2025 |
13.90 (5.3%) |
13.30 |
13.25 - 14.07 |
1.4355 times |
Fri 10 October 2025 |
13.20 (-5.38%) |
13.85 |
13.16 - 13.94 |
1.5167 times |
Fri 03 October 2025 |
13.95 (1.16%) |
13.83 |
13.69 - 14.06 |
1.4321 times |
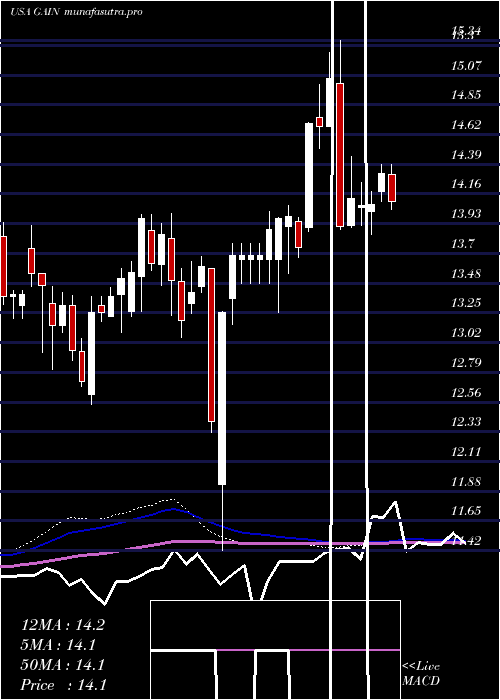
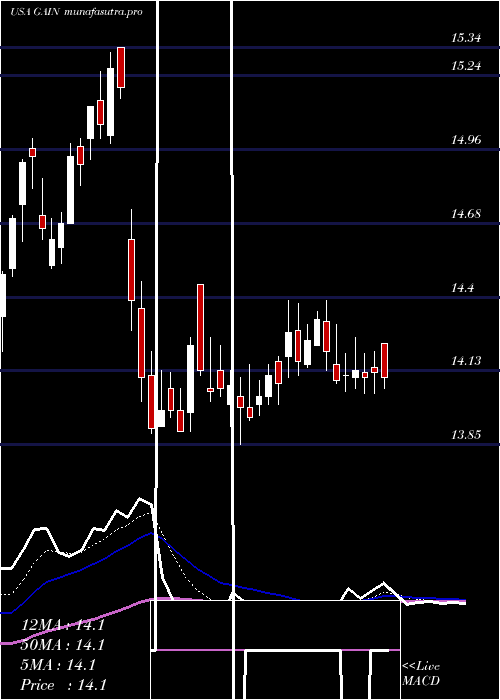
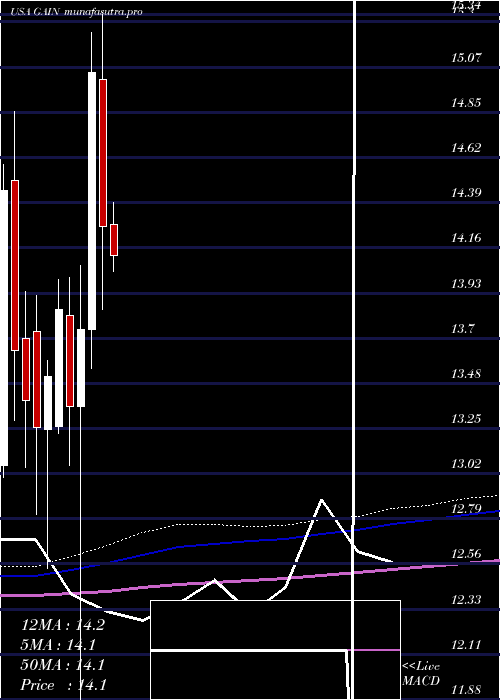
Monthly price and charts GladstoneInvestment Strong monthly Stock price targets for GladstoneInvestment GAIN are 13.87 and 14.08 | Monthly Target 1 | 13.74 | | Monthly Target 2 | 13.85 | | Monthly Target 3 | 13.946666666667 | | Monthly Target 4 | 14.06 | | Monthly Target 5 | 14.16 |
Monthly price and volumes Gladstone Investment
| Date |
Closing |
Open |
Range |
Volume |
Thu 04 December 2025 |
13.97 (-0.36%) |
13.97 |
13.83 - 14.04 |
0.1885 times |
Fri 28 November 2025 |
14.02 (1.45%) |
13.73 |
13.52 - 14.04 |
0.7324 times |
Fri 31 October 2025 |
13.82 (0%) |
13.74 |
13.16 - 14.15 |
1.3062 times |
Tue 30 September 2025 |
13.82 (-2.47%) |
14.09 |
13.70 - 14.40 |
1.3836 times |
Fri 29 August 2025 |
14.17 (2.02%) |
13.79 |
13.66 - 14.57 |
0.9917 times |
Thu 31 July 2025 |
13.89 (-2.66%) |
14.28 |
13.82 - 14.39 |
1.1393 times |
Mon 30 June 2025 |
14.27 (-5.18%) |
15.01 |
13.85 - 15.34 |
1.2809 times |
Fri 30 May 2025 |
15.05 (9.45%) |
13.75 |
13.55 - 15.25 |
1.0352 times |
Wed 30 April 2025 |
13.75 (2.92%) |
13.36 |
11.42 - 14.07 |
1.1519 times |
Mon 31 March 2025 |
13.36 (-3.54%) |
13.82 |
13.06 - 14.01 |
0.7904 times |
Fri 28 February 2025 |
13.85 (2.52%) |
13.26 |
13.22 - 14.00 |
0.7607 times |
DMA SMA EMA moving averages of Gladstone Investment GAIN
DMA (daily moving average) of Gladstone Investment GAIN
| DMA period | DMA value | | 5 day DMA | 13.97 | | 12 day DMA | 13.84 | | 20 day DMA | 13.84 | | 35 day DMA | 13.88 | | 50 day DMA | 13.84 | | 100 day DMA | 13.97 | | 150 day DMA | 14.07 | | 200 day DMA | 13.91 | EMA (exponential moving average) of Gladstone Investment GAIN
| EMA period | EMA current | EMA prev | EMA prev2 | | 5 day EMA | 13.95 | 13.94 | 13.94 | | 12 day EMA | 13.89 | 13.88 | 13.87 | | 20 day EMA | 13.88 | 13.87 | 13.86 | | 35 day EMA | 13.86 | 13.85 | 13.84 | | 50 day EMA | 13.85 | 13.85 | 13.85 |
SMA (simple moving average) of Gladstone Investment GAIN
| SMA period | SMA current | SMA prev | SMA prev2 | | 5 day SMA | 13.97 | 13.97 | 13.97 | | 12 day SMA | 13.84 | 13.81 | 13.79 | | 20 day SMA | 13.84 | 13.84 | 13.83 | | 35 day SMA | 13.88 | 13.88 | 13.88 | | 50 day SMA | 13.84 | 13.83 | 13.83 | | 100 day SMA | 13.97 | 13.97 | 13.97 | | 150 day SMA | 14.07 | 14.06 | 14.06 | | 200 day SMA | 13.91 | 13.91 | 13.91 |
|
|
