GaiaInc GAIA full analysis,charts,indicators,moving averages,SMA,DMA,EMA,ADX,MACD,RSIGaia Inc GAIA WideScreen charts, DMA,SMA,EMA technical analysis, forecast prediction, by indicators ADX,MACD,RSI,CCI USA stock exchange
operates under Consumer Services sector & deals in Movies Entertainment
Daily price and charts and targets GaiaInc Strong Daily Stock price targets for GaiaInc GAIA are 3.26 and 3.47 | Daily Target 1 | 3.08 | | Daily Target 2 | 3.22 | | Daily Target 3 | 3.2933333333333 | | Daily Target 4 | 3.43 | | Daily Target 5 | 3.5 |
Daily price and volume Gaia Inc
| Date |
Closing |
Open |
Range |
Volume |
Thu 04 December 2025 |
3.35 (2.13%) |
3.26 |
3.16 - 3.37 |
0.8805 times |
Wed 03 December 2025 |
3.28 (-3.53%) |
3.40 |
3.16 - 3.40 |
2.527 times |
Tue 02 December 2025 |
3.40 (-5.29%) |
3.59 |
3.33 - 3.59 |
1.4516 times |
Mon 01 December 2025 |
3.59 (-6.75%) |
3.82 |
3.53 - 3.82 |
0.8834 times |
Fri 28 November 2025 |
3.85 (0.52%) |
3.85 |
3.79 - 3.89 |
0.2187 times |
Wed 26 November 2025 |
3.83 (-2.05%) |
3.88 |
3.65 - 3.88 |
0.5873 times |
Tue 25 November 2025 |
3.91 (-0.26%) |
3.93 |
3.71 - 3.94 |
0.7325 times |
Mon 24 November 2025 |
3.92 (-2.97%) |
4.02 |
3.86 - 4.02 |
0.9445 times |
Fri 21 November 2025 |
4.04 (3.06%) |
3.92 |
3.85 - 4.05 |
0.85 times |
Thu 20 November 2025 |
3.92 (-1.51%) |
3.98 |
3.83 - 4.02 |
0.9245 times |
Wed 19 November 2025 |
3.98 (-1.24%) |
4.00 |
3.90 - 4.01 |
0.5214 times |
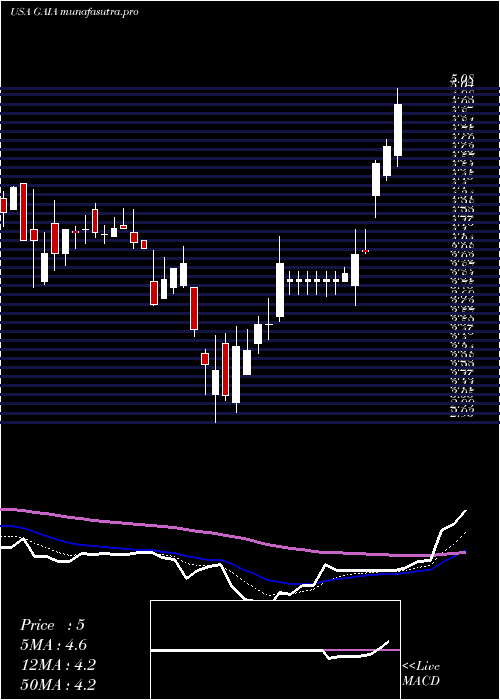
Weekly price and charts GaiaInc Strong weekly Stock price targets for GaiaInc GAIA are 2.93 and 3.59 | Weekly Target 1 | 2.78 | | Weekly Target 2 | 3.07 | | Weekly Target 3 | 3.4433333333333 | | Weekly Target 4 | 3.73 | | Weekly Target 5 | 4.1 |
Weekly price and volumes for Gaia Inc
| Date |
Closing |
Open |
Range |
Volume |
Thu 04 December 2025 |
3.35 (-12.99%) |
3.82 |
3.16 - 3.82 |
2.5452 times |
Fri 28 November 2025 |
3.85 (-4.7%) |
4.02 |
3.65 - 4.02 |
1.1005 times |
Fri 21 November 2025 |
4.04 (1.51%) |
3.96 |
3.83 - 4.09 |
1.2588 times |
Fri 14 November 2025 |
3.98 (-5.69%) |
4.23 |
3.92 - 4.48 |
0.7683 times |
Fri 07 November 2025 |
4.22 (-15.43%) |
5.05 |
4.07 - 5.05 |
0.949 times |
Fri 31 October 2025 |
4.99 (0%) |
4.99 |
4.76 - 5.14 |
0.1604 times |
Fri 31 October 2025 |
4.99 (-13.22%) |
5.83 |
4.59 - 5.95 |
1.1742 times |
Fri 24 October 2025 |
5.75 (1.95%) |
5.73 |
5.70 - 6.25 |
0.6171 times |
Fri 17 October 2025 |
5.64 (-6%) |
6.07 |
5.62 - 6.18 |
0.5321 times |
Fri 10 October 2025 |
6.00 (4.35%) |
5.81 |
5.59 - 6.39 |
0.8944 times |
Fri 03 October 2025 |
5.75 (-5.58%) |
6.09 |
5.51 - 6.30 |
0.5857 times |
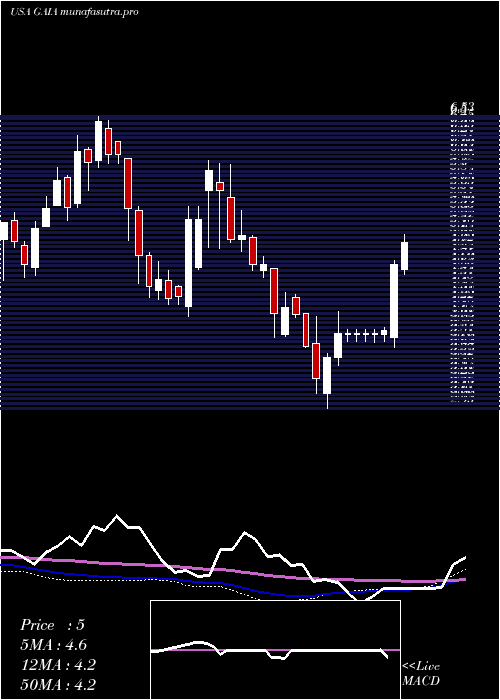
Monthly price and charts GaiaInc Strong monthly Stock price targets for GaiaInc GAIA are 2.93 and 3.59 | Monthly Target 1 | 2.78 | | Monthly Target 2 | 3.07 | | Monthly Target 3 | 3.4433333333333 | | Monthly Target 4 | 3.73 | | Monthly Target 5 | 4.1 |
Monthly price and volumes Gaia Inc
| Date |
Closing |
Open |
Range |
Volume |
Thu 04 December 2025 |
3.35 (-12.99%) |
3.82 |
3.16 - 3.82 |
0.5397 times |
Fri 28 November 2025 |
3.85 (-22.85%) |
5.05 |
3.65 - 5.05 |
0.8645 times |
Fri 31 October 2025 |
4.99 (-15.71%) |
5.88 |
4.59 - 6.39 |
0.7677 times |
Tue 30 September 2025 |
5.92 (4.23%) |
5.69 |
5.49 - 6.30 |
0.8882 times |
Fri 29 August 2025 |
5.68 (35.24%) |
4.15 |
3.91 - 5.77 |
0.6843 times |
Thu 31 July 2025 |
4.20 (-4.33%) |
4.36 |
3.78 - 4.65 |
0.7834 times |
Mon 30 June 2025 |
4.39 (-14.42%) |
5.11 |
4.29 - 5.37 |
2.8322 times |
Fri 30 May 2025 |
5.13 (-2.1%) |
5.30 |
4.22 - 5.53 |
0.8761 times |
Wed 30 April 2025 |
5.24 (36.1%) |
3.80 |
2.93 - 5.32 |
1.2278 times |
Mon 31 March 2025 |
3.85 (-18.26%) |
4.66 |
3.68 - 4.66 |
0.536 times |
Fri 28 February 2025 |
4.71 (-16.19%) |
5.53 |
4.55 - 5.94 |
0.9487 times |

DMA SMA EMA moving averages of Gaia Inc GAIA
DMA (daily moving average) of Gaia Inc GAIA
| DMA period | DMA value | | 5 day DMA | 3.49 | | 12 day DMA | 3.76 | | 20 day DMA | 3.93 | | 35 day DMA | 4.57 | | 50 day DMA | 4.99 | | 100 day DMA | 5.05 | | 150 day DMA | 4.94 | | 200 day DMA | 4.73 | EMA (exponential moving average) of Gaia Inc GAIA
| EMA period | EMA current | EMA prev | EMA prev2 | | 5 day EMA | 3.48 | 3.54 | 3.67 | | 12 day EMA | 3.72 | 3.79 | 3.88 | | 20 day EMA | 3.98 | 4.05 | 4.13 | | 35 day EMA | 4.46 | 4.53 | 4.6 | | 50 day EMA | 4.94 | 5 | 5.07 |
SMA (simple moving average) of Gaia Inc GAIA
| SMA period | SMA current | SMA prev | SMA prev2 | | 5 day SMA | 3.49 | 3.59 | 3.72 | | 12 day SMA | 3.76 | 3.81 | 3.86 | | 20 day SMA | 3.93 | 3.99 | 4.05 | | 35 day SMA | 4.57 | 4.65 | 4.73 | | 50 day SMA | 4.99 | 5.05 | 5.1 | | 100 day SMA | 5.05 | 5.06 | 5.06 | | 150 day SMA | 4.94 | 4.95 | 4.96 | | 200 day SMA | 4.73 | 4.74 | 4.74 |
|
|
