FvcbankcorpInc FVCB full analysis,charts,indicators,moving averages,SMA,DMA,EMA,ADX,MACD,RSIFvcbankcorp Inc FVCB WideScreen charts, DMA,SMA,EMA technical analysis, forecast prediction, by indicators ADX,MACD,RSI,CCI USA stock exchange
operates under Finance sector & deals in Major Banks
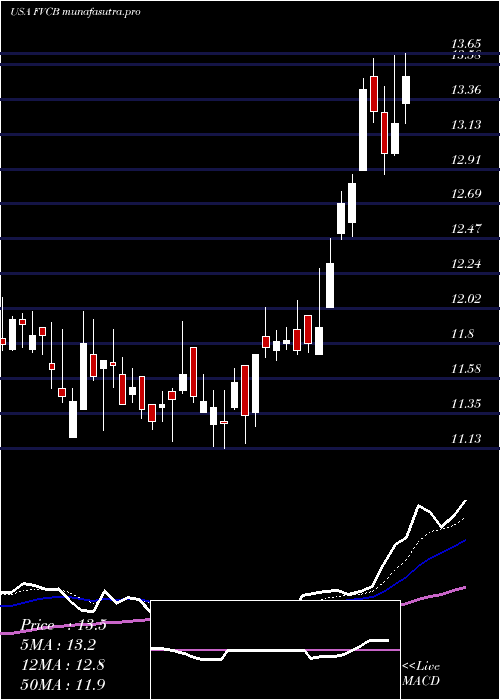
Daily price and charts and targets FvcbankcorpInc Strong Daily Stock price targets for FvcbankcorpInc FVCB are 12.95 and 13.15 | Daily Target 1 | 12.85 | | Daily Target 2 | 12.95 | | Daily Target 3 | 13.05 | | Daily Target 4 | 13.15 | | Daily Target 5 | 13.25 |
Daily price and volume Fvcbankcorp Inc
| Date |
Closing |
Open |
Range |
Volume |
Thu 04 December 2025 |
13.05 (0.38%) |
13.05 |
12.95 - 13.15 |
0.8092 times |
Wed 03 December 2025 |
13.00 (2.69%) |
12.77 |
12.72 - 13.03 |
0.8968 times |
Tue 02 December 2025 |
12.66 (0%) |
12.79 |
12.65 - 12.87 |
0.3978 times |
Mon 01 December 2025 |
12.66 (-0.39%) |
12.72 |
12.65 - 13.01 |
0.9069 times |
Fri 28 November 2025 |
12.71 (-0.39%) |
12.80 |
12.57 - 12.80 |
0.3945 times |
Wed 26 November 2025 |
12.76 (0.39%) |
12.68 |
12.58 - 12.84 |
3.6851 times |
Tue 25 November 2025 |
12.71 (1.76%) |
12.63 |
12.63 - 12.96 |
0.6608 times |
Mon 24 November 2025 |
12.49 (-0.64%) |
13.19 |
12.44 - 13.19 |
0.4754 times |
Fri 21 November 2025 |
12.57 (2.95%) |
12.25 |
12.25 - 12.66 |
1.2239 times |
Thu 20 November 2025 |
12.21 (0.41%) |
12.31 |
12.17 - 12.44 |
0.5496 times |
Wed 19 November 2025 |
12.16 (-0.65%) |
12.24 |
12.15 - 12.39 |
0.6878 times |
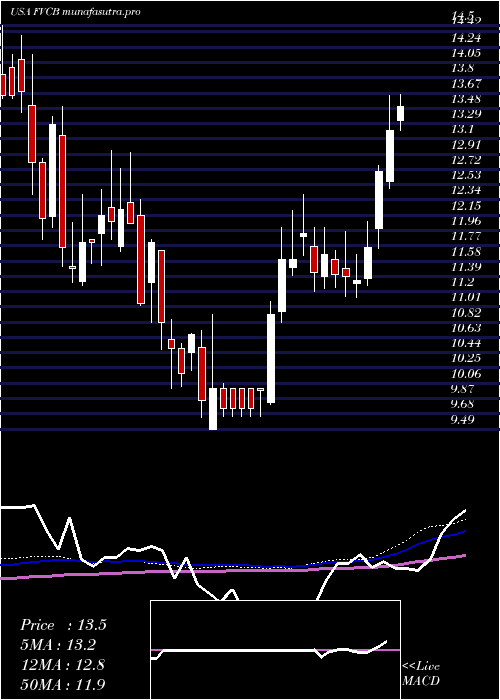
Weekly price and charts FvcbankcorpInc Strong weekly Stock price targets for FvcbankcorpInc FVCB are 12.85 and 13.35 | Weekly Target 1 | 12.45 | | Weekly Target 2 | 12.75 | | Weekly Target 3 | 12.95 | | Weekly Target 4 | 13.25 | | Weekly Target 5 | 13.45 |
Weekly price and volumes for Fvcbankcorp Inc
| Date |
Closing |
Open |
Range |
Volume |
Thu 04 December 2025 |
13.05 (2.68%) |
12.72 |
12.65 - 13.15 |
0.8323 times |
Fri 28 November 2025 |
12.71 (1.11%) |
13.19 |
12.44 - 13.19 |
1.4419 times |
Fri 21 November 2025 |
12.57 (-0.08%) |
12.74 |
12.13 - 12.74 |
1.1054 times |
Fri 14 November 2025 |
12.58 (2.28%) |
12.36 |
12.29 - 12.76 |
1.5202 times |
Fri 07 November 2025 |
12.30 (0.65%) |
12.23 |
11.93 - 12.49 |
0.4651 times |
Fri 31 October 2025 |
12.22 (0%) |
12.30 |
12.01 - 12.56 |
0.123 times |
Fri 31 October 2025 |
12.22 (-4.83%) |
12.90 |
11.83 - 13.07 |
1.1091 times |
Fri 24 October 2025 |
12.84 (6.56%) |
12.10 |
12.00 - 13.00 |
0.9684 times |
Fri 17 October 2025 |
12.05 (-0.5%) |
12.26 |
11.93 - 13.05 |
1.2499 times |
Fri 10 October 2025 |
12.11 (-4.5%) |
12.65 |
12.09 - 12.94 |
1.1846 times |
Fri 03 October 2025 |
12.68 (-4.01%) |
13.20 |
12.50 - 13.30 |
1.0738 times |
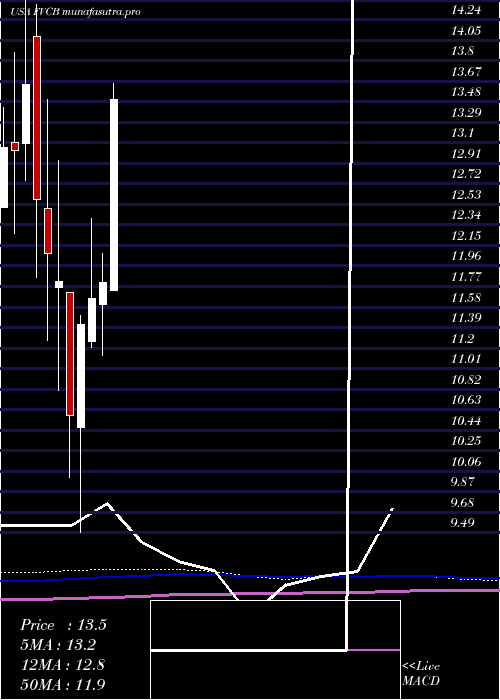
Monthly price and charts FvcbankcorpInc Strong monthly Stock price targets for FvcbankcorpInc FVCB are 12.85 and 13.35 | Monthly Target 1 | 12.45 | | Monthly Target 2 | 12.75 | | Monthly Target 3 | 12.95 | | Monthly Target 4 | 13.25 | | Monthly Target 5 | 13.45 |
Monthly price and volumes Fvcbankcorp Inc
| Date |
Closing |
Open |
Range |
Volume |
Thu 04 December 2025 |
13.05 (2.68%) |
12.72 |
12.65 - 13.15 |
0.1279 times |
Fri 28 November 2025 |
12.71 (4.01%) |
12.23 |
11.93 - 13.19 |
0.6967 times |
Fri 31 October 2025 |
12.22 (-5.78%) |
12.92 |
11.83 - 13.14 |
0.7982 times |
Tue 30 September 2025 |
12.97 (-4.42%) |
13.51 |
12.82 - 13.88 |
0.8534 times |
Fri 29 August 2025 |
13.57 (5.93%) |
12.68 |
12.25 - 13.74 |
1.2287 times |
Thu 31 July 2025 |
12.81 (8.56%) |
11.73 |
11.73 - 13.99 |
1.639 times |
Mon 30 June 2025 |
11.80 (1.2%) |
11.60 |
11.13 - 12.07 |
1.2655 times |
Fri 30 May 2025 |
11.66 (2.1%) |
11.26 |
11.20 - 12.40 |
1.1247 times |
Wed 30 April 2025 |
11.42 (8.04%) |
10.46 |
9.49 - 11.50 |
1.7578 times |
Mon 31 March 2025 |
10.57 (-10.5%) |
11.71 |
10.00 - 11.71 |
0.5081 times |
Fri 28 February 2025 |
11.81 (-2.15%) |
11.76 |
10.81 - 12.93 |
0.5022 times |
DMA SMA EMA moving averages of Fvcbankcorp Inc FVCB
DMA (daily moving average) of Fvcbankcorp Inc FVCB
| DMA period | DMA value | | 5 day DMA | 12.82 | | 12 day DMA | 12.6 | | 20 day DMA | 12.52 | | 35 day DMA | 12.42 | | 50 day DMA | 12.51 | | 100 day DMA | 12.86 | | 150 day DMA | 12.53 | | 200 day DMA | 12.03 | EMA (exponential moving average) of Fvcbankcorp Inc FVCB
| EMA period | EMA current | EMA prev | EMA prev2 | | 5 day EMA | 12.86 | 12.77 | 12.65 | | 12 day EMA | 12.69 | 12.63 | 12.56 | | 20 day EMA | 12.61 | 12.56 | 12.51 | | 35 day EMA | 12.61 | 12.58 | 12.55 | | 50 day EMA | 12.62 | 12.6 | 12.58 |
SMA (simple moving average) of Fvcbankcorp Inc FVCB
| SMA period | SMA current | SMA prev | SMA prev2 | | 5 day SMA | 12.82 | 12.76 | 12.7 | | 12 day SMA | 12.6 | 12.53 | 12.5 | | 20 day SMA | 12.52 | 12.49 | 12.44 | | 35 day SMA | 12.42 | 12.42 | 12.41 | | 50 day SMA | 12.51 | 12.51 | 12.52 | | 100 day SMA | 12.86 | 12.86 | 12.86 | | 150 day SMA | 12.53 | 12.52 | 12.51 | | 200 day SMA | 12.03 | 12.02 | 12.01 |
|
|
