FirstUs FUSB full analysis,charts,indicators,moving averages,SMA,DMA,EMA,ADX,MACD,RSIFirst Us FUSB WideScreen charts, DMA,SMA,EMA technical analysis, forecast prediction, by indicators ADX,MACD,RSI,CCI USA stock exchange
operates under Finance sector & deals in Major Banks
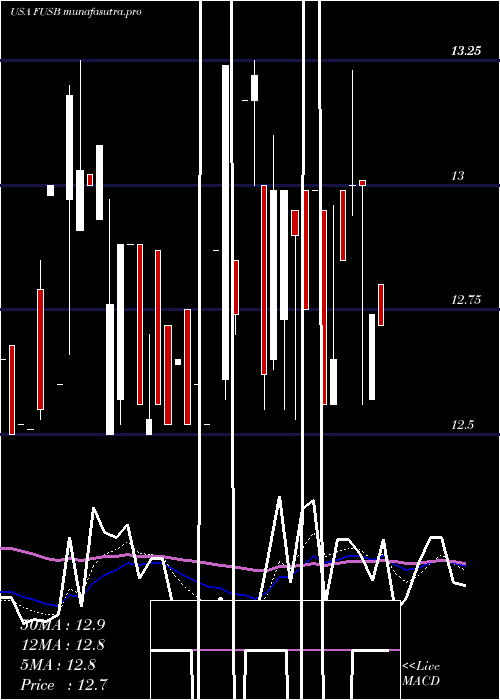
Daily price and charts and targets FirstUs Strong Daily Stock price targets for FirstUs FUSB are 12.16 and 12.16 | Daily Target 1 | 12.16 | | Daily Target 2 | 12.16 | | Daily Target 3 | 12.16 | | Daily Target 4 | 12.16 | | Daily Target 5 | 12.16 |
Daily price and volume First Us
| Date |
Closing |
Open |
Range |
Volume |
Tue 21 October 2025 |
12.16 (-1.86%) |
12.16 |
12.16 - 12.16 |
0.0699 times |
Fri 17 October 2025 |
12.39 (1.06%) |
12.39 |
12.39 - 12.39 |
0.3497 times |
Thu 16 October 2025 |
12.26 (-0.57%) |
12.44 |
12.15 - 12.44 |
3.7762 times |
Wed 15 October 2025 |
12.33 (-0.88%) |
12.35 |
12.25 - 12.35 |
0.4196 times |
Tue 14 October 2025 |
12.44 (0%) |
12.44 |
12.44 - 12.44 |
0.2797 times |
Mon 13 October 2025 |
12.44 (0.89%) |
12.44 |
12.44 - 12.44 |
0.3497 times |
Fri 10 October 2025 |
12.33 (0%) |
12.33 |
12.15 - 12.33 |
1.3287 times |
Thu 09 October 2025 |
12.33 (0%) |
12.33 |
12.16 - 12.33 |
0.6993 times |
Wed 08 October 2025 |
12.33 (-0.96%) |
12.18 |
12.18 - 12.41 |
1.1888 times |
Tue 07 October 2025 |
12.45 (2.22%) |
12.43 |
12.43 - 12.45 |
1.5385 times |
Mon 06 October 2025 |
12.18 (0%) |
12.19 |
12.18 - 12.19 |
1.049 times |
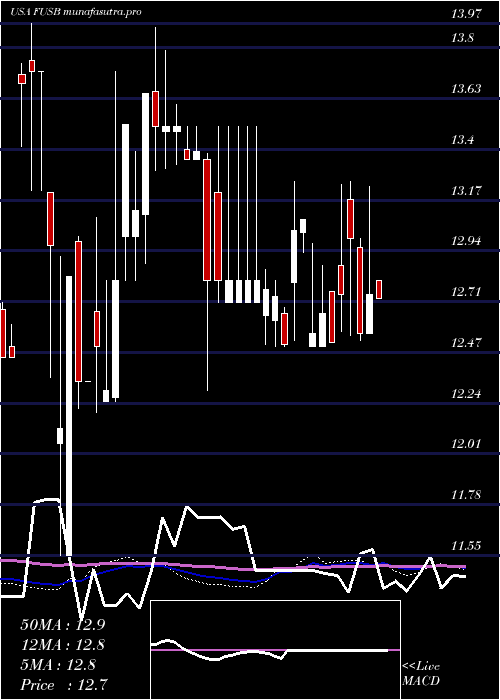
Weekly price and charts FirstUs Strong weekly Stock price targets for FirstUs FUSB are 12.16 and 12.16 | Weekly Target 1 | 12.16 | | Weekly Target 2 | 12.16 | | Weekly Target 3 | 12.16 | | Weekly Target 4 | 12.16 | | Weekly Target 5 | 12.16 |
Weekly price and volumes for First Us
| Date |
Closing |
Open |
Range |
Volume |
Tue 21 October 2025 |
12.16 (-1.86%) |
12.16 |
12.16 - 12.16 |
0.0065 times |
Fri 17 October 2025 |
12.39 (0.49%) |
12.44 |
12.15 - 12.44 |
0.4811 times |
Fri 10 October 2025 |
12.33 (1.23%) |
12.19 |
12.15 - 12.45 |
0.5396 times |
Fri 03 October 2025 |
12.18 (-1.69%) |
12.02 |
12.02 - 12.37 |
0.5404 times |
Fri 26 September 2025 |
12.39 (-9.5%) |
13.50 |
12.00 - 13.50 |
2.087 times |
Fri 19 September 2025 |
13.69 (14.08%) |
12.11 |
12.11 - 13.69 |
1.3978 times |
Fri 12 September 2025 |
12.00 (-0.08%) |
12.24 |
11.59 - 12.73 |
1.2808 times |
Fri 05 September 2025 |
12.01 (-3.53%) |
12.23 |
11.00 - 12.23 |
1.9959 times |
Fri 29 August 2025 |
12.45 (0%) |
11.09 |
11.09 - 12.45 |
0.5266 times |
Fri 29 August 2025 |
12.45 (0.08%) |
11.77 |
10.81 - 12.45 |
1.1443 times |
Fri 22 August 2025 |
12.44 (2.73%) |
11.92 |
11.04 - 12.44 |
0.9167 times |
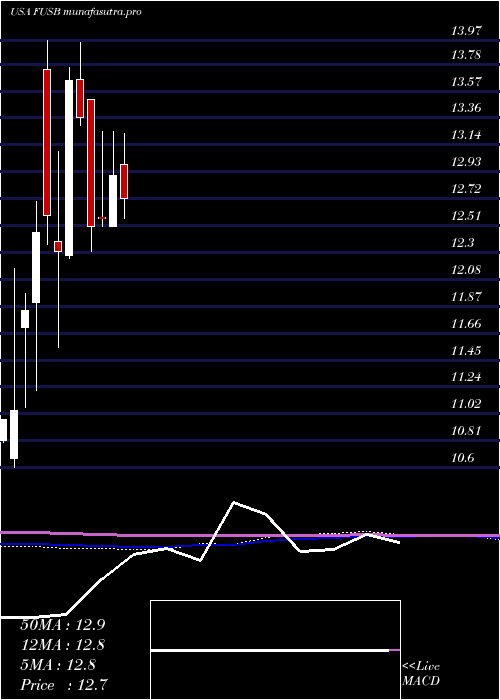
Monthly price and charts FirstUs Strong monthly Stock price targets for FirstUs FUSB are 11.88 and 12.31 | Monthly Target 1 | 11.78 | | Monthly Target 2 | 11.97 | | Monthly Target 3 | 12.21 | | Monthly Target 4 | 12.4 | | Monthly Target 5 | 12.64 |
Monthly price and volumes First Us
| Date |
Closing |
Open |
Range |
Volume |
Tue 21 October 2025 |
12.16 (1.16%) |
12.19 |
12.02 - 12.45 |
0.2367 times |
Tue 30 September 2025 |
12.02 (-3.45%) |
12.23 |
11.00 - 13.69 |
1.3174 times |
Fri 29 August 2025 |
12.45 (-5.54%) |
13.14 |
10.30 - 13.35 |
0.8079 times |
Thu 31 July 2025 |
13.18 (2.17%) |
12.99 |
12.56 - 13.42 |
0.4946 times |
Mon 30 June 2025 |
12.90 (2.71%) |
12.50 |
12.50 - 13.25 |
0.4367 times |
Fri 30 May 2025 |
12.56 (0.48%) |
12.57 |
12.50 - 13.25 |
0.5641 times |
Wed 30 April 2025 |
12.50 (-6.44%) |
13.50 |
12.30 - 13.50 |
3.1958 times |
Mon 31 March 2025 |
13.36 (-2.12%) |
13.66 |
13.30 - 13.95 |
1.6546 times |
Fri 28 February 2025 |
13.65 (10.98%) |
12.27 |
12.25 - 13.75 |
0.8746 times |
Fri 31 January 2025 |
12.30 (-2.3%) |
12.38 |
11.55 - 13.09 |
0.4177 times |
Tue 31 December 2024 |
12.59 (1.12%) |
13.74 |
12.36 - 13.97 |
0.7099 times |
DMA SMA EMA moving averages of First Us FUSB
DMA (daily moving average) of First Us FUSB
| DMA period | DMA value | | 5 day DMA | 12.32 | | 12 day DMA | 12.32 | | 20 day DMA | 12.26 | | 35 day DMA | 12.22 | | 50 day DMA | 12.12 | | 100 day DMA | 12.49 | | 150 day DMA | 12.69 | | 200 day DMA | 12.75 | EMA (exponential moving average) of First Us FUSB
| EMA period | EMA current | EMA prev | EMA prev2 | | 5 day EMA | 12.29 | 12.35 | 12.33 | | 12 day EMA | 12.3 | 12.33 | 12.32 | | 20 day EMA | 12.3 | 12.32 | 12.31 | | 35 day EMA | 12.24 | 12.24 | 12.23 | | 50 day EMA | 12.21 | 12.21 | 12.2 |
SMA (simple moving average) of First Us FUSB
| SMA period | SMA current | SMA prev | SMA prev2 | | 5 day SMA | 12.32 | 12.37 | 12.36 | | 12 day SMA | 12.32 | 12.31 | 12.31 | | 20 day SMA | 12.26 | 12.29 | 12.36 | | 35 day SMA | 12.22 | 12.23 | 12.18 | | 50 day SMA | 12.12 | 12.13 | 12.14 | | 100 day SMA | 12.49 | 12.49 | 12.49 | | 150 day SMA | 12.69 | 12.7 | 12.71 | | 200 day SMA | 12.75 | 12.76 | 12.77 |
|
|
