HB FUL full analysis,charts,indicators,moving averages,SMA,DMA,EMA,ADX,MACD,RSIH B FUL WideScreen charts, DMA,SMA,EMA technical analysis, forecast prediction, by indicators ADX,MACD,RSI,CCI USA stock exchange
operates under Basic Industries sector & deals in Home Furnishings
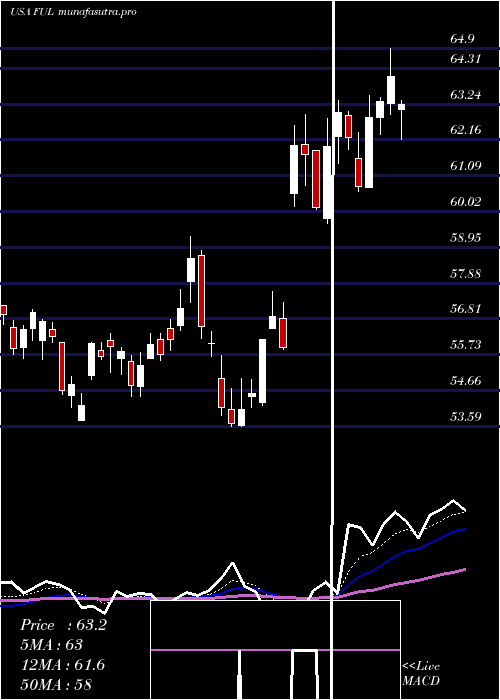
Daily price and charts and targets HB Strong Daily Stock price targets for HB FUL are 57.65 and 58.57 | Daily Target 1 | 57.48 | | Daily Target 2 | 57.82 | | Daily Target 3 | 58.403333333333 | | Daily Target 4 | 58.74 | | Daily Target 5 | 59.32 |
Daily price and volume H B
| Date |
Closing |
Open |
Range |
Volume |
Thu 04 December 2025 |
58.15 (-1.31%) |
58.88 |
58.07 - 58.99 |
0.8557 times |
Wed 03 December 2025 |
58.92 (0.86%) |
58.69 |
58.46 - 59.39 |
0.9046 times |
Tue 02 December 2025 |
58.42 (-0.07%) |
58.67 |
58.01 - 59.26 |
0.8496 times |
Mon 01 December 2025 |
58.46 (0.31%) |
58.03 |
57.92 - 59.18 |
0.918 times |
Fri 28 November 2025 |
58.28 (-0.66%) |
58.30 |
58.01 - 58.73 |
0.6098 times |
Wed 26 November 2025 |
58.67 (0.39%) |
58.16 |
58.11 - 59.43 |
1.4691 times |
Tue 25 November 2025 |
58.44 (3.01%) |
57.24 |
56.97 - 58.71 |
0.9664 times |
Mon 24 November 2025 |
56.73 (-1.06%) |
57.10 |
55.90 - 57.10 |
1.2365 times |
Fri 21 November 2025 |
57.34 (3.48%) |
55.51 |
55.08 - 58.23 |
1.0914 times |
Thu 20 November 2025 |
55.41 (-0.68%) |
56.00 |
55.28 - 56.61 |
1.0989 times |
Wed 19 November 2025 |
55.79 (-0.43%) |
56.14 |
55.08 - 56.20 |
0.8593 times |
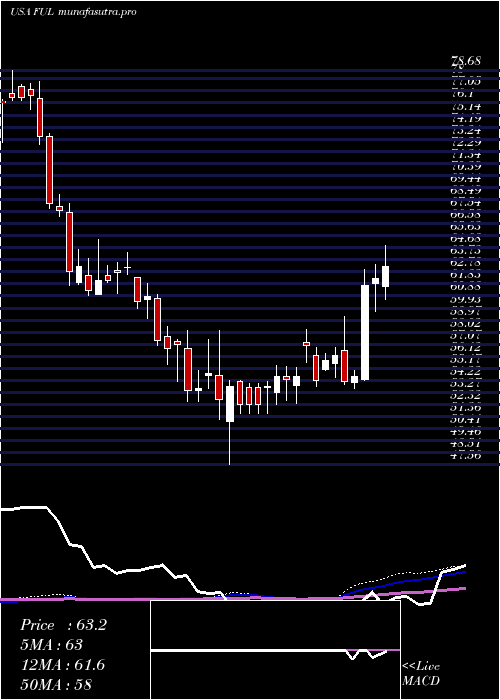
Weekly price and charts HB Strong weekly Stock price targets for HB FUL are 58.04 and 59.51 | Weekly Target 1 | 57.02 | | Weekly Target 2 | 57.58 | | Weekly Target 3 | 58.486666666667 | | Weekly Target 4 | 59.05 | | Weekly Target 5 | 59.96 |
Weekly price and volumes for H B
| Date |
Closing |
Open |
Range |
Volume |
Thu 04 December 2025 |
58.15 (-0.22%) |
58.03 |
57.92 - 59.39 |
0.9022 times |
Fri 28 November 2025 |
58.28 (1.64%) |
57.10 |
55.90 - 59.43 |
1.095 times |
Fri 21 November 2025 |
57.34 (-0.03%) |
57.34 |
55.08 - 58.23 |
1.3208 times |
Fri 14 November 2025 |
57.36 (-0.88%) |
58.43 |
55.76 - 58.91 |
1.2024 times |
Fri 07 November 2025 |
57.87 (0.87%) |
56.89 |
56.25 - 58.20 |
0.9487 times |
Fri 31 October 2025 |
57.37 (0%) |
57.04 |
56.68 - 57.62 |
0.336 times |
Fri 31 October 2025 |
57.37 (-6.7%) |
61.46 |
56.68 - 62.12 |
1.5818 times |
Fri 24 October 2025 |
61.49 (4.56%) |
58.90 |
58.78 - 61.99 |
1.3118 times |
Fri 17 October 2025 |
58.81 (0.41%) |
57.51 |
57.24 - 60.10 |
0.9079 times |
Tue 07 October 2025 |
58.57 (-1.2%) |
59.26 |
57.82 - 59.97 |
0.3934 times |
Fri 03 October 2025 |
59.28 (1.96%) |
58.24 |
56.78 - 59.87 |
1.2188 times |
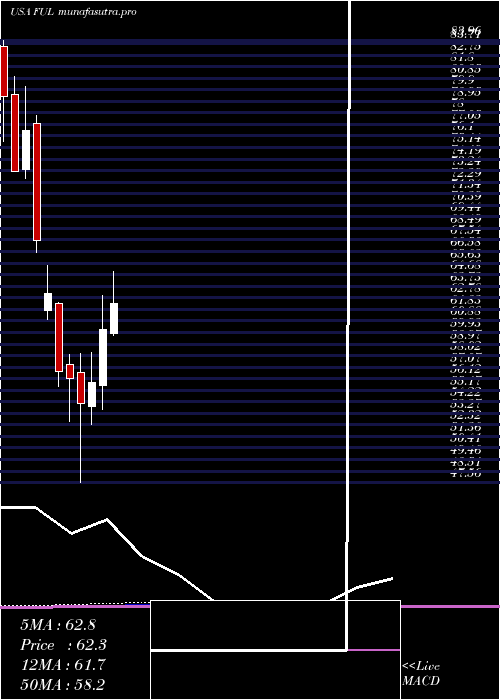
Monthly price and charts HB Strong monthly Stock price targets for HB FUL are 58.04 and 59.51 | Monthly Target 1 | 57.02 | | Monthly Target 2 | 57.58 | | Monthly Target 3 | 58.486666666667 | | Monthly Target 4 | 59.05 | | Monthly Target 5 | 59.96 |
Monthly price and volumes H B
| Date |
Closing |
Open |
Range |
Volume |
Thu 04 December 2025 |
58.15 (-0.22%) |
58.03 |
57.92 - 59.39 |
0.166 times |
Fri 28 November 2025 |
58.28 (1.59%) |
56.89 |
55.08 - 59.43 |
0.8405 times |
Fri 31 October 2025 |
57.37 (-3.22%) |
58.87 |
56.68 - 62.12 |
0.9485 times |
Tue 30 September 2025 |
59.28 (-2.9%) |
60.10 |
56.78 - 63.81 |
1.2778 times |
Fri 29 August 2025 |
61.05 (8.63%) |
55.39 |
54.58 - 62.64 |
0.8165 times |
Thu 31 July 2025 |
56.20 (-6.57%) |
59.81 |
55.72 - 64.90 |
1.2587 times |
Mon 30 June 2025 |
60.15 (7.76%) |
55.54 |
53.59 - 62.94 |
1.1727 times |
Fri 30 May 2025 |
55.82 (3.29%) |
53.85 |
52.37 - 58.25 |
0.756 times |
Wed 30 April 2025 |
54.04 (-3.71%) |
56.66 |
47.56 - 58.15 |
1.3583 times |
Mon 31 March 2025 |
56.12 (-1.09%) |
57.29 |
52.59 - 58.14 |
1.405 times |
Fri 28 February 2025 |
56.74 (-10.12%) |
62.31 |
55.45 - 62.36 |
1.0725 times |
DMA SMA EMA moving averages of H B FUL
DMA (daily moving average) of H B FUL
| DMA period | DMA value | | 5 day DMA | 58.45 | | 12 day DMA | 57.55 | | 20 day DMA | 57.56 | | 35 day DMA | 58.14 | | 50 day DMA | 58.36 | | 100 day DMA | 59.18 | | 150 day DMA | 58.37 | | 200 day DMA | 57.55 | EMA (exponential moving average) of H B FUL
| EMA period | EMA current | EMA prev | EMA prev2 | | 5 day EMA | 58.34 | 58.43 | 58.19 | | 12 day EMA | 57.99 | 57.96 | 57.79 | | 20 day EMA | 57.93 | 57.91 | 57.8 | | 35 day EMA | 58.19 | 58.19 | 58.15 | | 50 day EMA | 58.62 | 58.64 | 58.63 |
SMA (simple moving average) of H B FUL
| SMA period | SMA current | SMA prev | SMA prev2 | | 5 day SMA | 58.45 | 58.55 | 58.45 | | 12 day SMA | 57.55 | 57.4 | 57.27 | | 20 day SMA | 57.56 | 57.54 | 57.46 | | 35 day SMA | 58.14 | 58.17 | 58.18 | | 50 day SMA | 58.36 | 58.42 | 58.47 | | 100 day SMA | 59.18 | 59.24 | 59.28 | | 150 day SMA | 58.37 | 58.35 | 58.32 | | 200 day SMA | 57.55 | 57.56 | 57.57 |
|
|
