FortiveCorporation FTV full analysis,charts,indicators,moving averages,SMA,DMA,EMA,ADX,MACD,RSIFortive Corporation FTV WideScreen charts, DMA,SMA,EMA technical analysis, forecast prediction, by indicators ADX,MACD,RSI,CCI USA stock exchange
operates under Capital Goods sector & deals in Industrial Machinery Components
Daily price and charts and targets FortiveCorporation Strong Daily Stock price targets for FortiveCorporation FTV are 49.03 and 49.76 | Daily Target 1 | 48.45 | | Daily Target 2 | 48.87 | | Daily Target 3 | 49.183333333333 | | Daily Target 4 | 49.6 | | Daily Target 5 | 49.91 |
Daily price and volume Fortive Corporation
| Date |
Closing |
Open |
Range |
Volume |
Mon 20 October 2025 |
49.28 (1.27%) |
48.97 |
48.77 - 49.50 |
0.7519 times |
Fri 17 October 2025 |
48.66 (-0.06%) |
48.39 |
48.29 - 48.86 |
0.8982 times |
Thu 16 October 2025 |
48.69 (0.41%) |
48.89 |
48.28 - 48.94 |
0.9047 times |
Wed 15 October 2025 |
48.49 (-1.1%) |
48.44 |
48.10 - 49.55 |
1.7683 times |
Tue 14 October 2025 |
49.03 (0.93%) |
47.95 |
47.95 - 49.31 |
0.6875 times |
Mon 13 October 2025 |
48.58 (1.63%) |
48.24 |
48.03 - 48.86 |
0.944 times |
Fri 10 October 2025 |
47.80 (-3.04%) |
49.51 |
47.71 - 49.64 |
1.2263 times |
Thu 09 October 2025 |
49.30 (-1.08%) |
50.02 |
49.16 - 50.02 |
0.9788 times |
Wed 08 October 2025 |
49.84 (0.46%) |
49.91 |
49.32 - 50.15 |
0.926 times |
Tue 07 October 2025 |
49.61 (-0.84%) |
50.25 |
49.31 - 50.29 |
0.9143 times |
Mon 06 October 2025 |
50.03 (-0.75%) |
50.42 |
50.02 - 50.84 |
1.0293 times |
Weekly price and charts FortiveCorporation Strong weekly Stock price targets for FortiveCorporation FTV are 49.03 and 49.76 | Weekly Target 1 | 48.45 | | Weekly Target 2 | 48.87 | | Weekly Target 3 | 49.183333333333 | | Weekly Target 4 | 49.6 | | Weekly Target 5 | 49.91 |
Weekly price and volumes for Fortive Corporation
| Date |
Closing |
Open |
Range |
Volume |
Mon 20 October 2025 |
49.28 (1.27%) |
48.97 |
48.77 - 49.50 |
0.1141 times |
Fri 17 October 2025 |
48.66 (1.8%) |
48.24 |
47.95 - 49.55 |
0.7897 times |
Fri 10 October 2025 |
47.80 (-5.18%) |
50.42 |
47.71 - 50.84 |
0.7703 times |
Fri 03 October 2025 |
50.41 (3.87%) |
48.78 |
48.18 - 50.79 |
1.2467 times |
Fri 26 September 2025 |
48.53 (-0.21%) |
47.93 |
47.31 - 49.26 |
1.0651 times |
Fri 19 September 2025 |
48.63 (-0.41%) |
49.04 |
47.85 - 49.74 |
1.8257 times |
Fri 12 September 2025 |
48.83 (2.01%) |
47.70 |
47.01 - 49.75 |
1.6643 times |
Fri 05 September 2025 |
47.87 (0.02%) |
47.12 |
46.54 - 48.40 |
0.9908 times |
Fri 29 August 2025 |
47.86 (0%) |
47.98 |
47.69 - 48.41 |
0.2237 times |
Fri 29 August 2025 |
47.86 (-2.94%) |
49.13 |
47.68 - 49.25 |
1.3094 times |
Fri 22 August 2025 |
49.31 (2.39%) |
48.13 |
47.62 - 49.52 |
1.64 times |
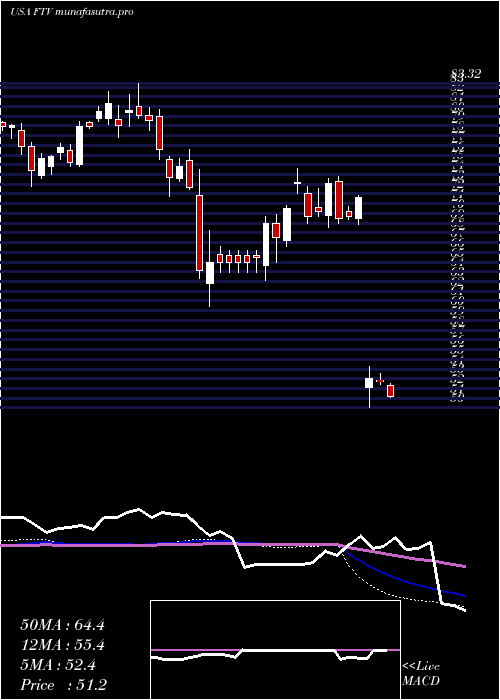
Monthly price and charts FortiveCorporation Strong monthly Stock price targets for FortiveCorporation FTV are 48.5 and 51.63 | Monthly Target 1 | 46.15 | | Monthly Target 2 | 47.71 | | Monthly Target 3 | 49.276666666667 | | Monthly Target 4 | 50.84 | | Monthly Target 5 | 52.41 |
Monthly price and volumes Fortive Corporation
| Date |
Closing |
Open |
Range |
Volume |
Mon 20 October 2025 |
49.28 (0.59%) |
48.90 |
47.71 - 50.84 |
0.4834 times |
Tue 30 September 2025 |
48.99 (2.36%) |
47.12 |
46.54 - 49.75 |
1.2039 times |
Fri 29 August 2025 |
47.86 (-0.15%) |
47.03 |
46.34 - 49.52 |
1.4134 times |
Thu 31 July 2025 |
47.93 (-8.06%) |
52.07 |
47.83 - 54.24 |
1.4048 times |
Mon 30 June 2025 |
52.13 (-25.73%) |
69.74 |
50.00 - 73.77 |
0.9168 times |
Fri 30 May 2025 |
70.19 (0.72%) |
65.28 |
64.99 - 74.67 |
1.3064 times |
Wed 30 April 2025 |
69.69 (-4.77%) |
73.00 |
60.39 - 74.52 |
0.9607 times |
Mon 31 March 2025 |
73.18 (-8%) |
79.99 |
71.45 - 80.74 |
0.742 times |
Fri 28 February 2025 |
79.54 (-2.2%) |
79.67 |
77.76 - 83.32 |
0.8502 times |
Fri 31 January 2025 |
81.33 (8.44%) |
75.46 |
74.28 - 82.50 |
0.7185 times |
Tue 31 December 2024 |
75.00 (-5.02%) |
78.88 |
72.73 - 79.28 |
0.6204 times |

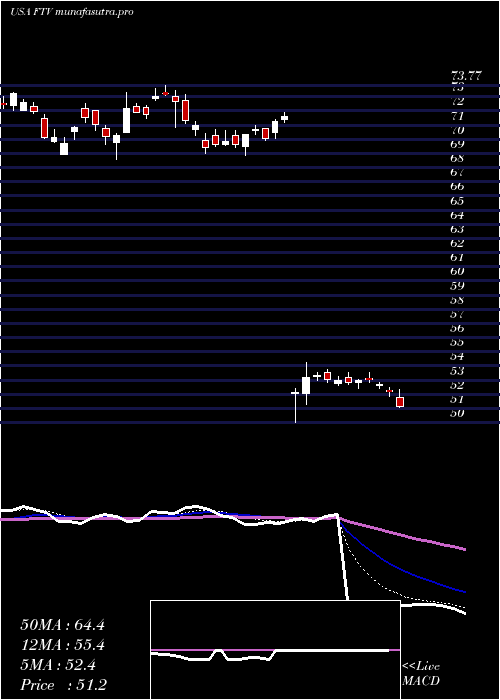
DMA SMA EMA moving averages of Fortive Corporation FTV
DMA (daily moving average) of Fortive Corporation FTV
| DMA period | DMA value | | 5 day DMA | 48.83 | | 12 day DMA | 49.14 | | 20 day DMA | 49.01 | | 35 day DMA | 48.66 | | 50 day DMA | 48.52 | | 100 day DMA | 53.88 | | 150 day DMA | 59.03 | | 200 day DMA | 63.94 | EMA (exponential moving average) of Fortive Corporation FTV
| EMA period | EMA current | EMA prev | EMA prev2 | | 5 day EMA | 48.91 | 48.72 | 48.75 | | 12 day EMA | 48.94 | 48.88 | 48.92 | | 20 day EMA | 48.91 | 48.87 | 48.89 | | 35 day EMA | 48.72 | 48.69 | 48.69 | | 50 day EMA | 48.46 | 48.43 | 48.42 |
SMA (simple moving average) of Fortive Corporation FTV
| SMA period | SMA current | SMA prev | SMA prev2 | | 5 day SMA | 48.83 | 48.69 | 48.52 | | 12 day SMA | 49.14 | 49.19 | 49.3 | | 20 day SMA | 49.01 | 48.97 | 48.96 | | 35 day SMA | 48.66 | 48.62 | 48.6 | | 50 day SMA | 48.52 | 48.46 | 48.43 | | 100 day SMA | 53.88 | 54.1 | 54.31 | | 150 day SMA | 59.03 | 59.2 | 59.36 | | 200 day SMA | 63.94 | 64.07 | 64.2 |
|
|
