LB FSTR full analysis,charts,indicators,moving averages,SMA,DMA,EMA,ADX,MACD,RSIL B FSTR WideScreen charts, DMA,SMA,EMA technical analysis, forecast prediction, by indicators ADX,MACD,RSI,CCI USA stock exchange
operates under Basic Industries sector & deals in Metal Fabrications
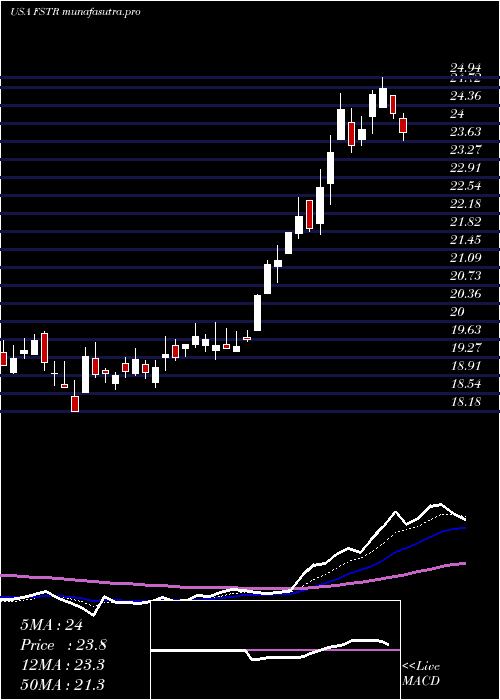
Daily price and charts and targets LB Strong Daily Stock price targets for LB FSTR are 26.73 and 27.64 | Daily Target 1 | 26.03 | | Daily Target 2 | 26.52 | | Daily Target 3 | 26.94 | | Daily Target 4 | 27.43 | | Daily Target 5 | 27.85 |
Daily price and volume L B
| Date |
Closing |
Open |
Range |
Volume |
Fri 05 December 2025 |
27.01 (0.93%) |
26.45 |
26.45 - 27.36 |
0.8227 times |
Thu 04 December 2025 |
26.76 (-2.01%) |
26.94 |
26.71 - 27.00 |
0.4114 times |
Wed 03 December 2025 |
27.31 (4.88%) |
26.24 |
26.24 - 27.33 |
0.8619 times |
Tue 02 December 2025 |
26.04 (-1.66%) |
26.71 |
26.04 - 26.75 |
0.4946 times |
Mon 01 December 2025 |
26.48 (-1.85%) |
26.56 |
26.22 - 26.83 |
1.0137 times |
Fri 28 November 2025 |
26.98 (0.11%) |
27.21 |
26.41 - 27.37 |
0.7835 times |
Wed 26 November 2025 |
26.95 (1.81%) |
26.27 |
25.66 - 27.13 |
1.0627 times |
Tue 25 November 2025 |
26.47 (-0.82%) |
26.80 |
26.30 - 26.99 |
1.3565 times |
Mon 24 November 2025 |
26.69 (-0.34%) |
26.61 |
26.61 - 27.07 |
1.8462 times |
Fri 21 November 2025 |
26.78 (2.21%) |
26.19 |
26.08 - 27.09 |
1.3467 times |
Thu 20 November 2025 |
26.20 (-1.65%) |
27.08 |
25.82 - 27.29 |
1.0039 times |
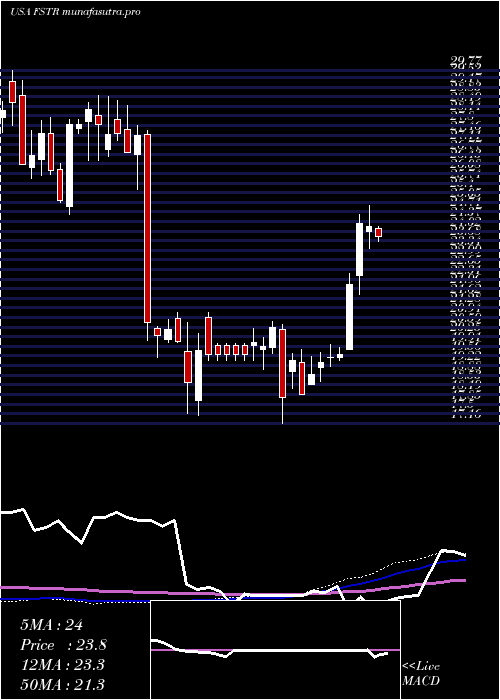
Weekly price and charts LB Strong weekly Stock price targets for LB FSTR are 26.53 and 27.85 | Weekly Target 1 | 25.48 | | Weekly Target 2 | 26.25 | | Weekly Target 3 | 26.803333333333 | | Weekly Target 4 | 27.57 | | Weekly Target 5 | 28.12 |
Weekly price and volumes for L B
| Date |
Closing |
Open |
Range |
Volume |
Fri 05 December 2025 |
27.01 (0.11%) |
26.56 |
26.04 - 27.36 |
0.7325 times |
Fri 28 November 2025 |
26.98 (0.75%) |
26.61 |
25.66 - 27.37 |
1.0261 times |
Fri 21 November 2025 |
26.78 (0.07%) |
26.48 |
25.82 - 27.29 |
1.1584 times |
Fri 14 November 2025 |
26.76 (-1.25%) |
27.17 |
26.31 - 28.39 |
1.1196 times |
Fri 07 November 2025 |
27.10 (-1.09%) |
26.51 |
26.02 - 27.94 |
1.0808 times |
Fri 31 October 2025 |
27.40 (0%) |
26.83 |
26.82 - 27.55 |
0.2478 times |
Fri 31 October 2025 |
27.40 (0.51%) |
27.54 |
25.96 - 27.59 |
1.3097 times |
Fri 24 October 2025 |
27.26 (4.13%) |
26.61 |
25.81 - 27.43 |
0.9594 times |
Fri 17 October 2025 |
26.18 (2.35%) |
25.58 |
25.39 - 27.52 |
1.3426 times |
Fri 10 October 2025 |
25.58 (-3.76%) |
26.73 |
25.56 - 26.76 |
1.0231 times |
Fri 03 October 2025 |
26.58 (-3.49%) |
27.63 |
26.22 - 27.86 |
0.8623 times |
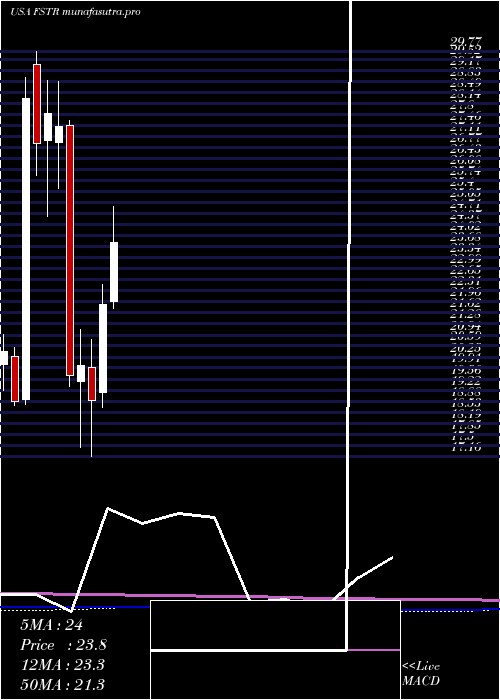
Monthly price and charts LB Strong monthly Stock price targets for LB FSTR are 26.53 and 27.85 | Monthly Target 1 | 25.48 | | Monthly Target 2 | 26.25 | | Monthly Target 3 | 26.803333333333 | | Monthly Target 4 | 27.57 | | Monthly Target 5 | 28.12 |
Monthly price and volumes L B
| Date |
Closing |
Open |
Range |
Volume |
Fri 05 December 2025 |
27.01 (0.11%) |
26.56 |
26.04 - 27.36 |
0.1186 times |
Fri 28 November 2025 |
26.98 (-1.53%) |
26.51 |
25.66 - 28.39 |
0.7103 times |
Fri 31 October 2025 |
27.40 (1.67%) |
26.78 |
25.39 - 27.59 |
0.8629 times |
Tue 30 September 2025 |
26.95 (3.53%) |
25.49 |
25.17 - 28.86 |
1.0396 times |
Fri 29 August 2025 |
26.03 (10.77%) |
22.66 |
21.67 - 26.85 |
1.217 times |
Thu 31 July 2025 |
23.50 (7.45%) |
21.98 |
21.76 - 25.03 |
1.0034 times |
Mon 30 June 2025 |
21.87 (15.78%) |
19.15 |
18.66 - 22.51 |
1.0116 times |
Fri 30 May 2025 |
18.89 (-5.41%) |
19.93 |
17.16 - 20.79 |
0.9505 times |
Wed 30 April 2025 |
19.97 (1.47%) |
19.50 |
17.43 - 21.10 |
1.5469 times |
Mon 31 March 2025 |
19.68 (-28.31%) |
27.47 |
19.32 - 27.63 |
1.5392 times |
Fri 28 February 2025 |
27.45 (-1.37%) |
26.94 |
25.50 - 28.85 |
1.1696 times |
DMA SMA EMA moving averages of L B FSTR
DMA (daily moving average) of L B FSTR
| DMA period | DMA value | | 5 day DMA | 26.72 | | 12 day DMA | 26.69 | | 20 day DMA | 26.77 | | 35 day DMA | 26.82 | | 50 day DMA | 26.74 | | 100 day DMA | 25.83 | | 150 day DMA | 24.04 | | 200 day DMA | 23.27 | EMA (exponential moving average) of L B FSTR
| EMA period | EMA current | EMA prev | EMA prev2 | | 5 day EMA | 26.84 | 26.75 | 26.75 | | 12 day EMA | 26.77 | 26.73 | 26.73 | | 20 day EMA | 26.77 | 26.75 | 26.75 | | 35 day EMA | 26.75 | 26.73 | 26.73 | | 50 day EMA | 26.78 | 26.77 | 26.77 |
SMA (simple moving average) of L B FSTR
| SMA period | SMA current | SMA prev | SMA prev2 | | 5 day SMA | 26.72 | 26.71 | 26.75 | | 12 day SMA | 26.69 | 26.63 | 26.61 | | 20 day SMA | 26.77 | 26.79 | 26.84 | | 35 day SMA | 26.82 | 26.81 | 26.83 | | 50 day SMA | 26.74 | 26.73 | 26.74 | | 100 day SMA | 25.83 | 25.79 | 25.76 | | 150 day SMA | 24.04 | 24 | 23.95 | | 200 day SMA | 23.27 | 23.27 | 23.28 |
|
|
