FsBancorp FSBW full analysis,charts,indicators,moving averages,SMA,DMA,EMA,ADX,MACD,RSIFs Bancorp FSBW WideScreen charts, DMA,SMA,EMA technical analysis, forecast prediction, by indicators ADX,MACD,RSI,CCI USA stock exchange
operates under Finance sector & deals in Banks
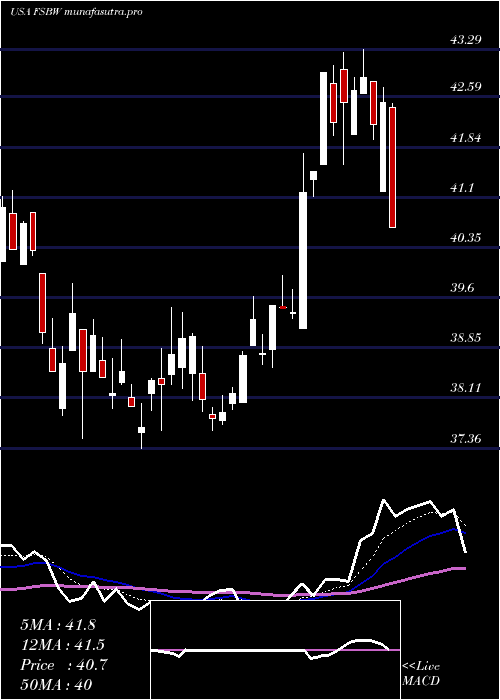
Daily price and charts and targets FsBancorp Strong Daily Stock price targets for FsBancorp FSBW are 38.16 and 38.61 | Daily Target 1 | 38.07 | | Daily Target 2 | 38.24 | | Daily Target 3 | 38.52 | | Daily Target 4 | 38.69 | | Daily Target 5 | 38.97 |
Daily price and volume Fs Bancorp
| Date |
Closing |
Open |
Range |
Volume |
Tue 21 October 2025 |
38.41 (-0.98%) |
38.55 |
38.35 - 38.80 |
0.6749 times |
Mon 20 October 2025 |
38.79 (2.95%) |
37.77 |
37.77 - 38.81 |
1.07 times |
Fri 17 October 2025 |
37.68 (0.78%) |
37.39 |
37.39 - 38.05 |
0.9383 times |
Thu 16 October 2025 |
37.39 (-2.91%) |
37.76 |
37.35 - 37.88 |
1.3909 times |
Wed 15 October 2025 |
38.51 (-1.13%) |
38.99 |
37.97 - 38.99 |
0.8889 times |
Tue 14 October 2025 |
38.95 (1.62%) |
37.83 |
37.72 - 39.18 |
0.823 times |
Mon 13 October 2025 |
38.33 (2%) |
38.20 |
37.85 - 38.46 |
1.1358 times |
Fri 10 October 2025 |
37.58 (-2.89%) |
38.73 |
37.50 - 39.13 |
1.2757 times |
Thu 09 October 2025 |
38.70 (-2.49%) |
39.69 |
38.70 - 39.69 |
0.8724 times |
Wed 08 October 2025 |
39.69 (0.25%) |
39.84 |
39.34 - 40.04 |
0.93 times |
Tue 07 October 2025 |
39.59 (-0.65%) |
39.90 |
39.59 - 40.21 |
1.0617 times |
Weekly price and charts FsBancorp Strong weekly Stock price targets for FsBancorp FSBW are 38.09 and 39.13 | Weekly Target 1 | 37.29 | | Weekly Target 2 | 37.85 | | Weekly Target 3 | 38.33 | | Weekly Target 4 | 38.89 | | Weekly Target 5 | 39.37 |
Weekly price and volumes for Fs Bancorp
| Date |
Closing |
Open |
Range |
Volume |
Tue 21 October 2025 |
38.41 (1.94%) |
37.77 |
37.77 - 38.81 |
0.3148 times |
Fri 17 October 2025 |
37.68 (0.27%) |
38.20 |
37.35 - 39.18 |
0.934 times |
Fri 10 October 2025 |
37.58 (-6.14%) |
40.29 |
37.50 - 40.64 |
0.9845 times |
Fri 03 October 2025 |
40.04 (-1.45%) |
40.56 |
39.00 - 40.74 |
1.0964 times |
Fri 26 September 2025 |
40.63 (-1.43%) |
41.18 |
40.60 - 41.63 |
1.1731 times |
Fri 19 September 2025 |
41.22 (-0.55%) |
41.69 |
40.60 - 42.83 |
2.2259 times |
Fri 12 September 2025 |
41.45 (-1.78%) |
42.20 |
41.20 - 42.23 |
0.8716 times |
Fri 05 September 2025 |
42.20 (-1.19%) |
42.09 |
41.95 - 42.79 |
0.7588 times |
Fri 29 August 2025 |
42.71 (0%) |
42.82 |
42.49 - 42.82 |
0.2361 times |
Fri 29 August 2025 |
42.71 (0.78%) |
41.69 |
41.39 - 42.89 |
1.4047 times |
Fri 22 August 2025 |
42.38 (5.58%) |
40.16 |
39.28 - 42.78 |
1.6379 times |
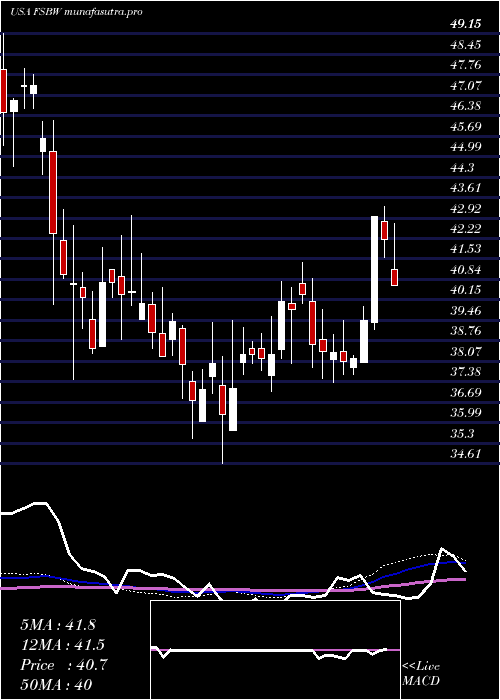
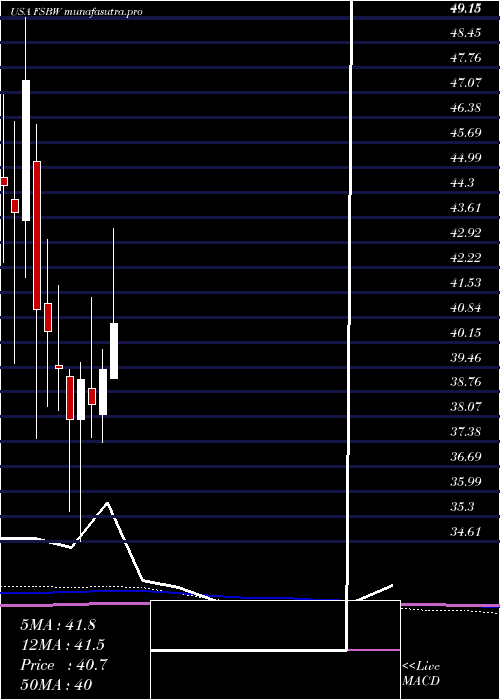
Monthly price and charts FsBancorp Strong monthly Stock price targets for FsBancorp FSBW are 36.19 and 39.58 | Monthly Target 1 | 35.44 | | Monthly Target 2 | 36.93 | | Monthly Target 3 | 38.833333333333 | | Monthly Target 4 | 40.32 | | Monthly Target 5 | 42.22 |
Monthly price and volumes Fs Bancorp
| Date |
Closing |
Open |
Range |
Volume |
Tue 21 October 2025 |
38.41 (-3.78%) |
39.46 |
37.35 - 40.74 |
0.6074 times |
Tue 30 September 2025 |
39.92 (-6.53%) |
42.09 |
39.35 - 42.83 |
1.1975 times |
Fri 29 August 2025 |
42.71 (9.26%) |
38.92 |
36.72 - 42.89 |
1.1658 times |
Thu 31 July 2025 |
39.09 (-0.74%) |
39.14 |
38.70 - 43.29 |
1.084 times |
Mon 30 June 2025 |
39.38 (2.53%) |
38.14 |
37.36 - 39.93 |
1.0039 times |
Fri 30 May 2025 |
38.41 (-1.76%) |
38.87 |
37.50 - 41.40 |
1.1821 times |
Wed 30 April 2025 |
39.10 (2.87%) |
38.00 |
34.61 - 39.58 |
1.0582 times |
Mon 31 March 2025 |
38.01 (-3.55%) |
39.20 |
35.46 - 39.40 |
0.7992 times |
Fri 28 February 2025 |
39.41 (-2.55%) |
39.50 |
38.25 - 41.72 |
0.8471 times |
Fri 31 January 2025 |
40.44 (-1.51%) |
41.22 |
38.35 - 43.00 |
1.0547 times |
Tue 31 December 2024 |
41.06 (-13.38%) |
45.16 |
37.47 - 46.20 |
0.7 times |
DMA SMA EMA moving averages of Fs Bancorp FSBW
DMA (daily moving average) of Fs Bancorp FSBW
| DMA period | DMA value | | 5 day DMA | 38.16 | | 12 day DMA | 38.62 | | 20 day DMA | 39.24 | | 35 day DMA | 40.3 | | 50 day DMA | 40.64 | | 100 day DMA | 40.26 | | 150 day DMA | 39.69 | | 200 day DMA | 39.66 | EMA (exponential moving average) of Fs Bancorp FSBW
| EMA period | EMA current | EMA prev | EMA prev2 | | 5 day EMA | 38.34 | 38.3 | 38.05 | | 12 day EMA | 38.67 | 38.72 | 38.71 | | 20 day EMA | 39.14 | 39.22 | 39.26 | | 35 day EMA | 39.68 | 39.76 | 39.82 | | 50 day EMA | 40.26 | 40.34 | 40.4 |
SMA (simple moving average) of Fs Bancorp FSBW
| SMA period | SMA current | SMA prev | SMA prev2 | | 5 day SMA | 38.16 | 38.26 | 38.17 | | 12 day SMA | 38.62 | 38.76 | 38.81 | | 20 day SMA | 39.24 | 39.36 | 39.5 | | 35 day SMA | 40.3 | 40.4 | 40.52 | | 50 day SMA | 40.64 | 40.68 | 40.68 | | 100 day SMA | 40.26 | 40.26 | 40.27 | | 150 day SMA | 39.69 | 39.67 | 39.66 | | 200 day SMA | 39.66 | 39.67 | 39.68 |
|
|
