FsbBancorp FSBC full analysis,charts,indicators,moving averages,SMA,DMA,EMA,ADX,MACD,RSIFsb Bancorp FSBC WideScreen charts, DMA,SMA,EMA technical analysis, forecast prediction, by indicators ADX,MACD,RSI,CCI USA stock exchange
operates under Finance sector & deals in Savings Institutions
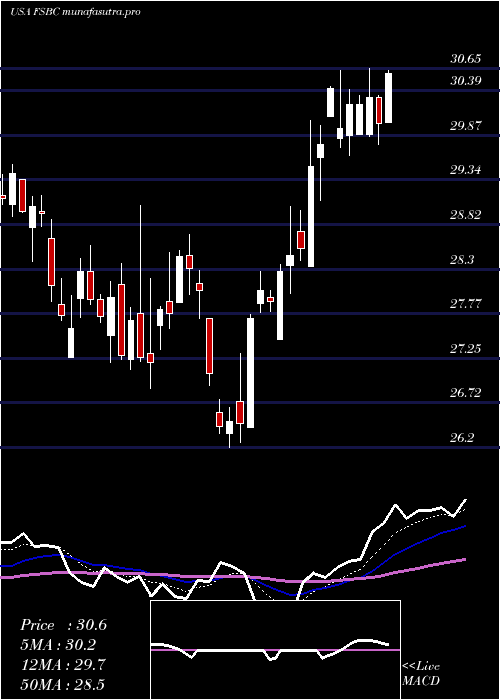
Daily price and charts and targets FsbBancorp Strong Daily Stock price targets for FsbBancorp FSBC are 32.64 and 33.82 | Daily Target 1 | 31.67 | | Daily Target 2 | 32.43 | | Daily Target 3 | 32.846666666667 | | Daily Target 4 | 33.61 | | Daily Target 5 | 34.03 |
Daily price and volume Fsb Bancorp
| Date |
Closing |
Open |
Range |
Volume |
Mon 20 October 2025 |
33.20 (2.82%) |
32.47 |
32.08 - 33.26 |
1.0549 times |
Fri 17 October 2025 |
32.29 (2.51%) |
31.69 |
31.61 - 32.38 |
1.6848 times |
Thu 16 October 2025 |
31.50 (-3.85%) |
32.64 |
30.68 - 32.64 |
1.1574 times |
Wed 15 October 2025 |
32.76 (-0.88%) |
33.21 |
32.21 - 33.53 |
0.5714 times |
Tue 14 October 2025 |
33.05 (4.29%) |
31.47 |
31.37 - 33.13 |
1.8232 times |
Mon 13 October 2025 |
31.69 (1.86%) |
31.48 |
30.68 - 31.71 |
0.9995 times |
Fri 10 October 2025 |
31.11 (-0.45%) |
31.56 |
30.89 - 32.31 |
1.5741 times |
Thu 09 October 2025 |
31.25 (-0.95%) |
31.53 |
30.94 - 31.53 |
0.3402 times |
Wed 08 October 2025 |
31.55 (-0.63%) |
31.99 |
31.45 - 31.99 |
0.3207 times |
Tue 07 October 2025 |
31.75 (-0.97%) |
32.19 |
31.59 - 32.30 |
0.4737 times |
Mon 06 October 2025 |
32.06 (-0.03%) |
32.18 |
31.80 - 32.68 |
0.6137 times |
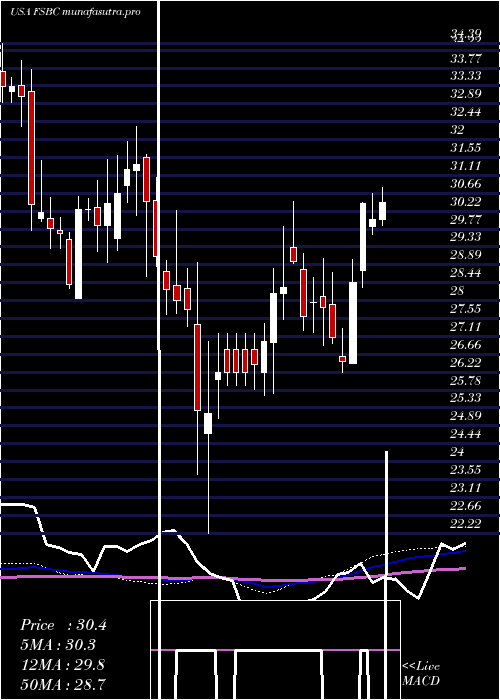
Weekly price and charts FsbBancorp Strong weekly Stock price targets for FsbBancorp FSBC are 32.64 and 33.82 | Weekly Target 1 | 31.67 | | Weekly Target 2 | 32.43 | | Weekly Target 3 | 32.846666666667 | | Weekly Target 4 | 33.61 | | Weekly Target 5 | 34.03 |
Weekly price and volumes for Fsb Bancorp
| Date |
Closing |
Open |
Range |
Volume |
Mon 20 October 2025 |
33.20 (2.82%) |
32.47 |
32.08 - 33.26 |
0.3875 times |
Fri 17 October 2025 |
32.29 (3.79%) |
31.48 |
30.68 - 33.53 |
2.2911 times |
Fri 10 October 2025 |
31.11 (-2.99%) |
32.18 |
30.89 - 32.68 |
1.2206 times |
Fri 03 October 2025 |
32.07 (-2.26%) |
32.97 |
31.13 - 33.00 |
0.9562 times |
Fri 26 September 2025 |
32.81 (-0.42%) |
32.83 |
32.35 - 33.87 |
1.092 times |
Fri 19 September 2025 |
32.95 (0.4%) |
32.97 |
31.90 - 34.01 |
1.6279 times |
Fri 12 September 2025 |
32.82 (-0.03%) |
32.95 |
32.20 - 33.33 |
0.7099 times |
Fri 05 September 2025 |
32.83 (0.18%) |
32.42 |
32.05 - 33.50 |
0.5592 times |
Fri 29 August 2025 |
32.77 (0%) |
33.00 |
32.49 - 33.10 |
0.2099 times |
Fri 29 August 2025 |
32.77 (0.49%) |
32.66 |
31.34 - 33.41 |
0.9455 times |
Fri 22 August 2025 |
32.61 (5.91%) |
29.59 |
29.48 - 33.07 |
1.1459 times |
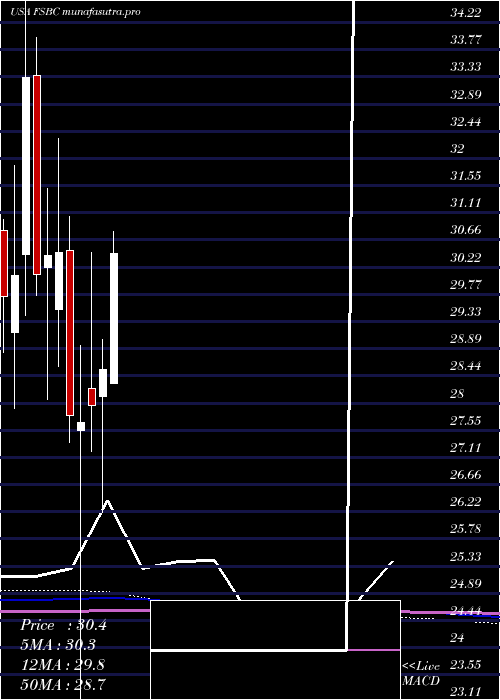
Monthly price and charts FsbBancorp Strong monthly Stock price targets for FsbBancorp FSBC are 31.94 and 34.79 | Monthly Target 1 | 29.62 | | Monthly Target 2 | 31.41 | | Monthly Target 3 | 32.47 | | Monthly Target 4 | 34.26 | | Monthly Target 5 | 35.32 |
Monthly price and volumes Fsb Bancorp
| Date |
Closing |
Open |
Range |
Volume |
Mon 20 October 2025 |
33.20 (3.11%) |
31.91 |
30.68 - 33.53 |
0.761 times |
Tue 30 September 2025 |
32.20 (-1.74%) |
32.42 |
31.67 - 34.01 |
0.75 times |
Fri 29 August 2025 |
32.77 (8.91%) |
29.86 |
28.34 - 33.41 |
0.7311 times |
Thu 31 July 2025 |
30.09 (5.43%) |
28.32 |
28.32 - 31.40 |
0.9026 times |
Mon 30 June 2025 |
28.54 (2.07%) |
28.11 |
26.20 - 29.04 |
1.1647 times |
Fri 30 May 2025 |
27.96 (1.01%) |
28.24 |
27.20 - 30.45 |
1.0198 times |
Wed 30 April 2025 |
27.68 (-0.43%) |
27.55 |
22.22 - 28.94 |
1.3934 times |
Mon 31 March 2025 |
27.80 (-8.73%) |
30.49 |
27.35 - 31.05 |
1.4876 times |
Fri 28 February 2025 |
30.46 (0.16%) |
29.53 |
28.59 - 32.33 |
0.7956 times |
Fri 31 January 2025 |
30.41 (1.06%) |
30.21 |
28.05 - 31.50 |
0.9943 times |
Tue 31 December 2024 |
30.09 (-9.69%) |
33.35 |
29.75 - 33.97 |
0.7608 times |
DMA SMA EMA moving averages of Fsb Bancorp FSBC
DMA (daily moving average) of Fsb Bancorp FSBC
| DMA period | DMA value | | 5 day DMA | 32.56 | | 12 day DMA | 32.02 | | 20 day DMA | 32.23 | | 35 day DMA | 32.49 | | 50 day DMA | 32.32 | | 100 day DMA | 30.7 | | 150 day DMA | 29.6 | | 200 day DMA | 29.74 | EMA (exponential moving average) of Fsb Bancorp FSBC
| EMA period | EMA current | EMA prev | EMA prev2 | | 5 day EMA | 32.47 | 32.11 | 32.02 | | 12 day EMA | 32.25 | 32.08 | 32.04 | | 20 day EMA | 32.24 | 32.14 | 32.12 | | 35 day EMA | 32.13 | 32.07 | 32.06 | | 50 day EMA | 32.14 | 32.1 | 32.09 |
SMA (simple moving average) of Fsb Bancorp FSBC
| SMA period | SMA current | SMA prev | SMA prev2 | | 5 day SMA | 32.56 | 32.26 | 32.02 | | 12 day SMA | 32.02 | 31.91 | 31.89 | | 20 day SMA | 32.23 | 32.22 | 32.25 | | 35 day SMA | 32.49 | 32.48 | 32.5 | | 50 day SMA | 32.32 | 32.25 | 32.2 | | 100 day SMA | 30.7 | 30.65 | 30.6 | | 150 day SMA | 29.6 | 29.57 | 29.54 | | 200 day SMA | 29.74 | 29.72 | 29.71 |
|
|
