FreshpetInc FRPT full analysis,charts,indicators,moving averages,SMA,DMA,EMA,ADX,MACD,RSIFreshpet Inc FRPT WideScreen charts, DMA,SMA,EMA technical analysis, forecast prediction, by indicators ADX,MACD,RSI,CCI USA stock exchange
operates under Consumer Non Durables sector & deals in Packaged Foods
Daily price and charts and targets FreshpetInc Strong Daily Stock price targets for FreshpetInc FRPT are 60.44 and 62.55 | Daily Target 1 | 59.92 | | Daily Target 2 | 60.96 | | Daily Target 3 | 62.033333333333 | | Daily Target 4 | 63.07 | | Daily Target 5 | 64.14 |
Daily price and volume Freshpet Inc
| Date |
Closing |
Open |
Range |
Volume |
Thu 04 December 2025 |
61.99 (-0.31%) |
62.53 |
61.00 - 63.11 |
1.0036 times |
Wed 03 December 2025 |
62.18 (6.91%) |
58.18 |
58.03 - 63.05 |
1.9241 times |
Tue 02 December 2025 |
58.16 (1.5%) |
57.31 |
56.28 - 58.50 |
1.2629 times |
Mon 01 December 2025 |
57.30 (0.24%) |
56.72 |
56.66 - 58.61 |
1.2848 times |
Fri 28 November 2025 |
57.16 (1.6%) |
56.47 |
56.31 - 57.54 |
0.2248 times |
Wed 26 November 2025 |
56.26 (0.84%) |
55.71 |
55.71 - 57.80 |
0.967 times |
Tue 25 November 2025 |
55.79 (4.05%) |
53.62 |
53.62 - 56.11 |
0.7781 times |
Mon 24 November 2025 |
53.62 (-0.7%) |
53.90 |
53.17 - 54.76 |
0.922 times |
Fri 21 November 2025 |
54.00 (2.27%) |
53.31 |
52.87 - 55.00 |
0.6994 times |
Thu 20 November 2025 |
52.80 (-0.79%) |
53.07 |
52.14 - 53.99 |
0.9331 times |
Wed 19 November 2025 |
53.22 (0.7%) |
52.88 |
51.80 - 53.92 |
0.5786 times |
Weekly price and charts FreshpetInc Strong weekly Stock price targets for FreshpetInc FRPT are 59.14 and 65.97 | Weekly Target 1 | 53.63 | | Weekly Target 2 | 57.81 | | Weekly Target 3 | 60.46 | | Weekly Target 4 | 64.64 | | Weekly Target 5 | 67.29 |
Weekly price and volumes for Freshpet Inc
| Date |
Closing |
Open |
Range |
Volume |
Thu 04 December 2025 |
61.99 (8.45%) |
56.72 |
56.28 - 63.11 |
1.0593 times |
Fri 28 November 2025 |
57.16 (5.85%) |
53.90 |
53.17 - 57.80 |
0.5595 times |
Fri 21 November 2025 |
54.00 (1.05%) |
53.36 |
51.80 - 55.00 |
0.7293 times |
Fri 14 November 2025 |
53.44 (-3.28%) |
55.33 |
52.13 - 57.64 |
0.824 times |
Fri 07 November 2025 |
55.25 (12.27%) |
56.57 |
54.19 - 57.62 |
0.99 times |
Fri 31 October 2025 |
49.21 (0%) |
50.74 |
48.76 - 51.74 |
0.5604 times |
Fri 31 October 2025 |
49.21 (-9.07%) |
54.09 |
48.76 - 55.97 |
1.4136 times |
Fri 24 October 2025 |
54.12 (5.5%) |
51.73 |
50.93 - 57.58 |
1.0823 times |
Fri 17 October 2025 |
51.30 (6.1%) |
48.40 |
48.20 - 53.74 |
1.3012 times |
Fri 10 October 2025 |
48.35 (-9.63%) |
53.83 |
46.76 - 54.56 |
1.4803 times |
Fri 03 October 2025 |
53.50 (7.69%) |
49.85 |
49.53 - 56.01 |
1.5195 times |

Monthly price and charts FreshpetInc Strong monthly Stock price targets for FreshpetInc FRPT are 59.14 and 65.97 | Monthly Target 1 | 53.63 | | Monthly Target 2 | 57.81 | | Monthly Target 3 | 60.46 | | Monthly Target 4 | 64.64 | | Monthly Target 5 | 67.29 |
Monthly price and volumes Freshpet Inc
| Date |
Closing |
Open |
Range |
Volume |
Thu 04 December 2025 |
61.99 (8.45%) |
56.72 |
56.28 - 63.11 |
0.2216 times |
Fri 28 November 2025 |
57.16 (16.16%) |
56.57 |
51.80 - 57.80 |
0.649 times |
Fri 31 October 2025 |
49.21 (-10.71%) |
55.21 |
46.76 - 57.58 |
1.3697 times |
Tue 30 September 2025 |
55.11 (-1.27%) |
55.07 |
48.41 - 57.13 |
1.3382 times |
Fri 29 August 2025 |
55.82 (-18.3%) |
68.00 |
55.75 - 70.53 |
1.0613 times |
Thu 31 July 2025 |
68.32 (0.53%) |
67.77 |
66.75 - 76.37 |
1.0209 times |
Mon 30 June 2025 |
67.96 (-15.22%) |
81.09 |
67.03 - 83.52 |
0.8439 times |
Fri 30 May 2025 |
80.16 (9%) |
73.76 |
72.64 - 89.80 |
1.1102 times |
Wed 30 April 2025 |
73.54 (-11.58%) |
83.71 |
71.19 - 86.19 |
0.8401 times |
Mon 31 March 2025 |
83.17 (-22.29%) |
107.10 |
80.27 - 108.05 |
1.5451 times |
Fri 28 February 2025 |
107.03 (-33.09%) |
157.00 |
97.48 - 162.19 |
1.1836 times |

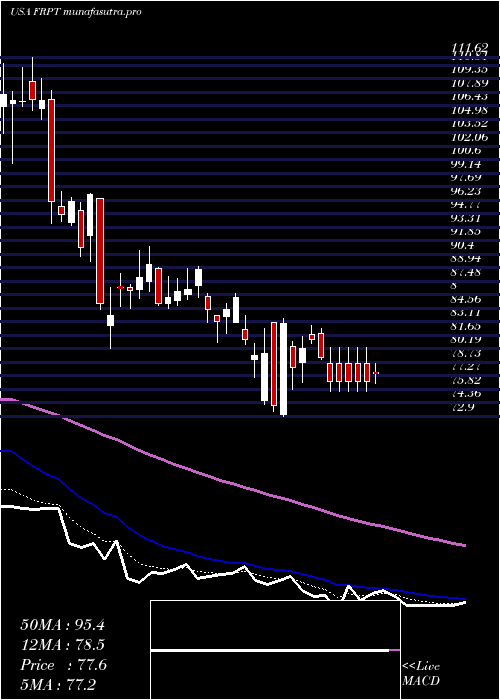
DMA SMA EMA moving averages of Freshpet Inc FRPT
DMA (daily moving average) of Freshpet Inc FRPT
| DMA period | DMA value | | 5 day DMA | 59.36 | | 12 day DMA | 56.28 | | 20 day DMA | 55.66 | | 35 day DMA | 54.71 | | 50 day DMA | 53.75 | | 100 day DMA | 57.28 | | 150 day DMA | 63.81 | | 200 day DMA | 69.51 | EMA (exponential moving average) of Freshpet Inc FRPT
| EMA period | EMA current | EMA prev | EMA prev2 | | 5 day EMA | 59.76 | 58.64 | 56.87 | | 12 day EMA | 57.46 | 56.64 | 55.63 | | 20 day EMA | 56.27 | 55.67 | 54.98 | | 35 day EMA | 54.97 | 54.56 | 54.11 | | 50 day EMA | 54.07 | 53.75 | 53.41 |
SMA (simple moving average) of Freshpet Inc FRPT
| SMA period | SMA current | SMA prev | SMA prev2 | | 5 day SMA | 59.36 | 58.21 | 56.93 | | 12 day SMA | 56.28 | 55.51 | 54.78 | | 20 day SMA | 55.66 | 55.43 | 55.12 | | 35 day SMA | 54.71 | 54.41 | 54.11 | | 50 day SMA | 53.75 | 53.5 | 53.24 | | 100 day SMA | 57.28 | 57.35 | 57.45 | | 150 day SMA | 63.81 | 63.88 | 63.96 | | 200 day SMA | 69.51 | 69.86 | 70.2 |
|
|
