FarmlandPartners FPI full analysis,charts,indicators,moving averages,SMA,DMA,EMA,ADX,MACD,RSIFarmland Partners FPI WideScreen charts, DMA,SMA,EMA technical analysis, forecast prediction, by indicators ADX,MACD,RSI,CCI USA stock exchange
operates under Consumer Services sector & deals in Real Estate Investment Trusts
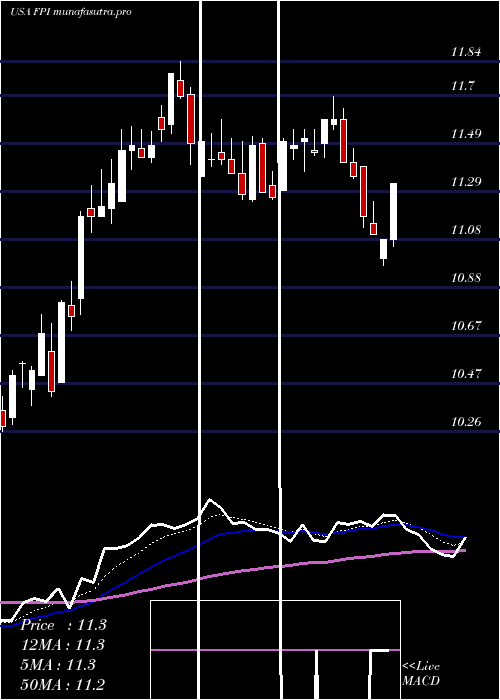
Daily price and charts and targets FarmlandPartners Strong Daily Stock price targets for FarmlandPartners FPI are 9.88 and 10 | Daily Target 1 | 9.86 | | Daily Target 2 | 9.9 | | Daily Target 3 | 9.9766666666667 | | Daily Target 4 | 10.02 | | Daily Target 5 | 10.1 |
Daily price and volume Farmland Partners
| Date |
Closing |
Open |
Range |
Volume |
Thu 04 December 2025 |
9.95 (-0.5%) |
10.05 |
9.93 - 10.05 |
0.5356 times |
Wed 03 December 2025 |
10.00 (1.73%) |
9.86 |
9.83 - 10.00 |
0.76 times |
Tue 02 December 2025 |
9.83 (1.13%) |
9.73 |
9.65 - 9.91 |
0.8849 times |
Mon 01 December 2025 |
9.72 (-1.22%) |
9.77 |
9.66 - 9.80 |
0.7989 times |
Fri 28 November 2025 |
9.84 (0.72%) |
9.78 |
9.67 - 9.84 |
0.8871 times |
Wed 26 November 2025 |
9.77 (1.14%) |
9.61 |
9.61 - 9.84 |
1.0371 times |
Tue 25 November 2025 |
9.66 (0.84%) |
9.63 |
9.61 - 9.75 |
1.1269 times |
Mon 24 November 2025 |
9.58 (-0.1%) |
9.57 |
9.52 - 9.63 |
2.6677 times |
Fri 21 November 2025 |
9.59 (1.48%) |
9.48 |
9.47 - 9.68 |
0.6444 times |
Thu 20 November 2025 |
9.45 (0.53%) |
9.50 |
9.42 - 9.52 |
0.6574 times |
Wed 19 November 2025 |
9.40 (-1.05%) |
9.45 |
9.37 - 9.48 |
0.5577 times |
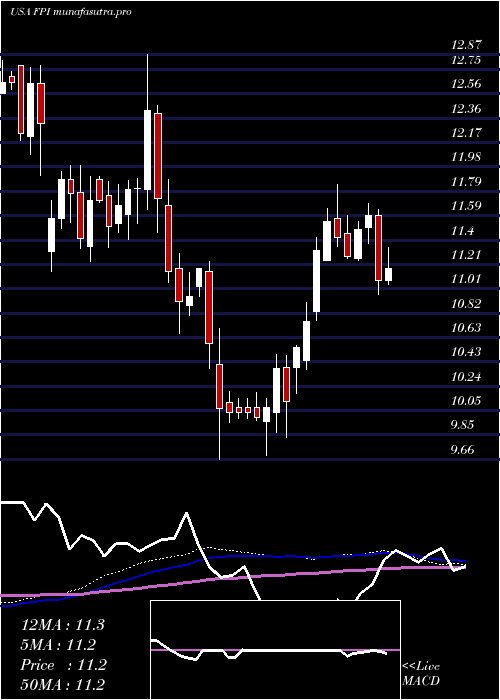
Weekly price and charts FarmlandPartners Strong weekly Stock price targets for FarmlandPartners FPI are 9.8 and 10.2 | Weekly Target 1 | 9.48 | | Weekly Target 2 | 9.72 | | Weekly Target 3 | 9.8833333333333 | | Weekly Target 4 | 10.12 | | Weekly Target 5 | 10.28 |
Weekly price and volumes for Farmland Partners
| Date |
Closing |
Open |
Range |
Volume |
Thu 04 December 2025 |
9.95 (1.12%) |
9.77 |
9.65 - 10.05 |
0.9412 times |
Fri 28 November 2025 |
9.84 (2.61%) |
9.57 |
9.52 - 9.84 |
1.8065 times |
Fri 21 November 2025 |
9.59 (-1.13%) |
9.72 |
9.37 - 9.73 |
0.9983 times |
Fri 14 November 2025 |
9.70 (0%) |
9.75 |
9.61 - 9.88 |
1.1567 times |
Fri 07 November 2025 |
9.70 (-3.29%) |
10.07 |
9.63 - 10.09 |
1.1997 times |
Fri 31 October 2025 |
10.03 (0%) |
10.27 |
9.90 - 10.27 |
0.2776 times |
Fri 31 October 2025 |
10.03 (-1.96%) |
10.25 |
9.90 - 10.55 |
1.1456 times |
Fri 24 October 2025 |
10.23 (0.2%) |
10.26 |
10.11 - 10.36 |
0.6882 times |
Fri 17 October 2025 |
10.21 (0.1%) |
10.21 |
10.13 - 10.66 |
0.9746 times |
Fri 10 October 2025 |
10.20 (-4.67%) |
10.70 |
10.20 - 10.70 |
0.8116 times |
Fri 03 October 2025 |
10.70 (-1.92%) |
10.92 |
10.56 - 10.95 |
0.7903 times |
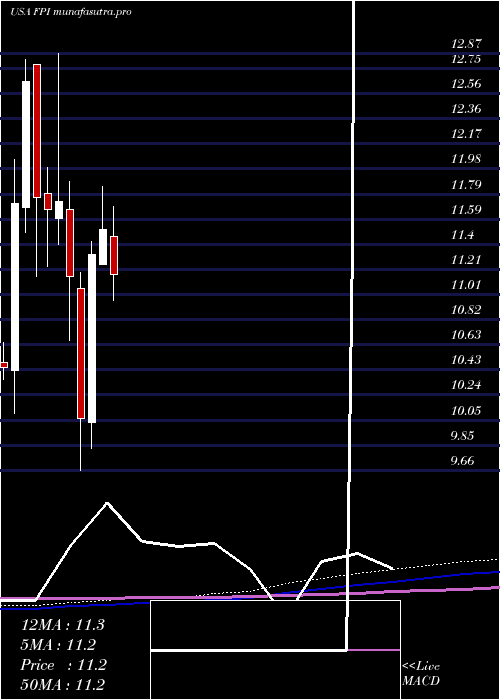
Monthly price and charts FarmlandPartners Strong monthly Stock price targets for FarmlandPartners FPI are 9.8 and 10.2 | Monthly Target 1 | 9.48 | | Monthly Target 2 | 9.72 | | Monthly Target 3 | 9.8833333333333 | | Monthly Target 4 | 10.12 | | Monthly Target 5 | 10.28 |
Monthly price and volumes Farmland Partners
| Date |
Closing |
Open |
Range |
Volume |
Thu 04 December 2025 |
9.95 (1.12%) |
9.77 |
9.65 - 10.05 |
0.2464 times |
Fri 28 November 2025 |
9.84 (-1.89%) |
10.07 |
9.37 - 10.09 |
1.3511 times |
Fri 31 October 2025 |
10.03 (-7.81%) |
10.80 |
9.90 - 10.86 |
1.1393 times |
Tue 30 September 2025 |
10.88 (-1.27%) |
10.93 |
10.52 - 11.15 |
0.8881 times |
Fri 29 August 2025 |
11.02 (5.25%) |
10.49 |
10.49 - 11.12 |
0.859 times |
Thu 31 July 2025 |
10.47 (-9.04%) |
11.46 |
10.43 - 11.69 |
1.2655 times |
Mon 30 June 2025 |
11.51 (1.68%) |
11.24 |
11.24 - 11.84 |
1.1994 times |
Fri 30 May 2025 |
11.32 (12.52%) |
10.03 |
9.83 - 11.42 |
1.0945 times |
Wed 30 April 2025 |
10.06 (-9.78%) |
11.06 |
9.66 - 11.18 |
0.9463 times |
Mon 31 March 2025 |
11.15 (-4.94%) |
11.67 |
10.66 - 11.88 |
1.0102 times |
Fri 28 February 2025 |
11.73 (0.51%) |
11.60 |
11.40 - 12.87 |
0.9398 times |
DMA SMA EMA moving averages of Farmland Partners FPI
DMA (daily moving average) of Farmland Partners FPI
| DMA period | DMA value | | 5 day DMA | 9.87 | | 12 day DMA | 9.69 | | 20 day DMA | 9.7 | | 35 day DMA | 9.9 | | 50 day DMA | 10.1 | | 100 day DMA | 10.5 | | 150 day DMA | 10.68 | | 200 day DMA | 10.71 | EMA (exponential moving average) of Farmland Partners FPI
| EMA period | EMA current | EMA prev | EMA prev2 | | 5 day EMA | 9.87 | 9.83 | 9.75 | | 12 day EMA | 9.78 | 9.75 | 9.71 | | 20 day EMA | 9.81 | 9.8 | 9.78 | | 35 day EMA | 9.94 | 9.94 | 9.94 | | 50 day EMA | 10.15 | 10.16 | 10.17 |
SMA (simple moving average) of Farmland Partners FPI
| SMA period | SMA current | SMA prev | SMA prev2 | | 5 day SMA | 9.87 | 9.83 | 9.76 | | 12 day SMA | 9.69 | 9.66 | 9.63 | | 20 day SMA | 9.7 | 9.7 | 9.69 | | 35 day SMA | 9.9 | 9.91 | 9.92 | | 50 day SMA | 10.1 | 10.12 | 10.14 | | 100 day SMA | 10.5 | 10.51 | 10.52 | | 150 day SMA | 10.68 | 10.68 | 10.68 | | 200 day SMA | 10.71 | 10.72 | 10.73 |
|
|
