FivePoint FPH full analysis,charts,indicators,moving averages,SMA,DMA,EMA,ADX,MACD,RSIFive Point FPH WideScreen charts, DMA,SMA,EMA technical analysis, forecast prediction, by indicators ADX,MACD,RSI,CCI USA stock exchange
operates under Finance sector & deals in Real Estate
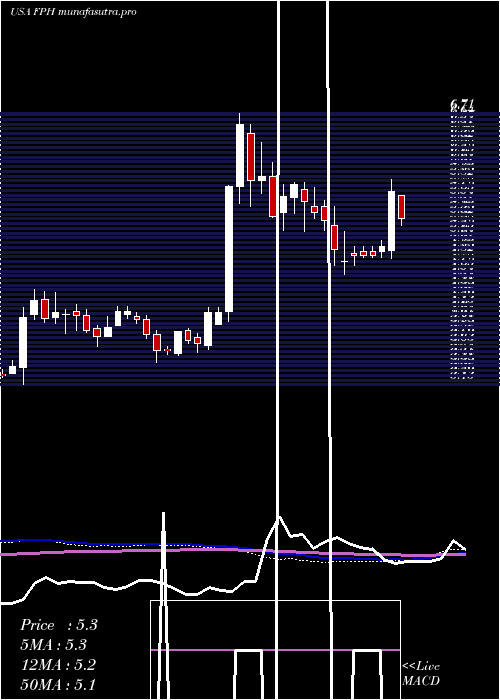
Daily price and charts and targets FivePoint Strong Daily Stock price targets for FivePoint FPH are 5.79 and 6 | Daily Target 1 | 5.74 | | Daily Target 2 | 5.83 | | Daily Target 3 | 5.95 | | Daily Target 4 | 6.04 | | Daily Target 5 | 6.16 |
Daily price and volume Five Point
| Date |
Closing |
Open |
Range |
Volume |
Thu 04 December 2025 |
5.92 (-2.47%) |
6.01 |
5.86 - 6.07 |
0.9552 times |
Wed 03 December 2025 |
6.07 (-0.16%) |
6.09 |
6.04 - 6.13 |
0.6922 times |
Tue 02 December 2025 |
6.08 (-0.98%) |
6.13 |
6.06 - 6.18 |
0.5632 times |
Mon 01 December 2025 |
6.14 (-0.97%) |
6.13 |
6.03 - 6.19 |
0.8653 times |
Fri 28 November 2025 |
6.20 (0.65%) |
6.20 |
6.17 - 6.24 |
0.379 times |
Wed 26 November 2025 |
6.16 (-1.28%) |
6.24 |
6.15 - 6.25 |
0.6321 times |
Tue 25 November 2025 |
6.24 (-0.32%) |
6.32 |
6.19 - 6.42 |
3.2693 times |
Mon 24 November 2025 |
6.26 (1.79%) |
6.11 |
6.05 - 6.34 |
1.2313 times |
Fri 21 November 2025 |
6.15 (0%) |
6.15 |
6.10 - 6.28 |
0.7133 times |
Thu 20 November 2025 |
6.15 (-0.16%) |
6.21 |
6.12 - 6.28 |
0.6991 times |
Wed 19 November 2025 |
6.16 (-2.07%) |
6.28 |
6.09 - 6.39 |
2.2603 times |
Weekly price and charts FivePoint Strong weekly Stock price targets for FivePoint FPH are 5.73 and 6.06 | Weekly Target 1 | 5.66 | | Weekly Target 2 | 5.79 | | Weekly Target 3 | 5.99 | | Weekly Target 4 | 6.12 | | Weekly Target 5 | 6.32 |
Weekly price and volumes for Five Point
| Date |
Closing |
Open |
Range |
Volume |
Thu 04 December 2025 |
5.92 (-4.52%) |
6.13 |
5.86 - 6.19 |
0.7192 times |
Fri 28 November 2025 |
6.20 (0.81%) |
6.11 |
6.05 - 6.42 |
1.2887 times |
Fri 21 November 2025 |
6.15 (-1.76%) |
6.25 |
6.09 - 6.47 |
2.062 times |
Fri 14 November 2025 |
6.26 (6.64%) |
5.94 |
5.87 - 6.30 |
1.2819 times |
Fri 07 November 2025 |
5.87 (0.34%) |
5.86 |
5.74 - 6.08 |
0.7389 times |
Fri 31 October 2025 |
5.85 (0%) |
5.78 |
5.65 - 5.93 |
0.2041 times |
Fri 31 October 2025 |
5.85 (-4.88%) |
6.18 |
5.49 - 6.29 |
1.1143 times |
Fri 24 October 2025 |
6.15 (3.89%) |
5.94 |
5.87 - 6.18 |
0.7707 times |
Fri 17 October 2025 |
5.92 (2.96%) |
5.81 |
5.63 - 6.22 |
0.7791 times |
Fri 10 October 2025 |
5.75 (-5.43%) |
6.08 |
5.71 - 6.11 |
1.0411 times |
Fri 03 October 2025 |
6.08 (-2.41%) |
6.25 |
5.92 - 6.25 |
0.888 times |
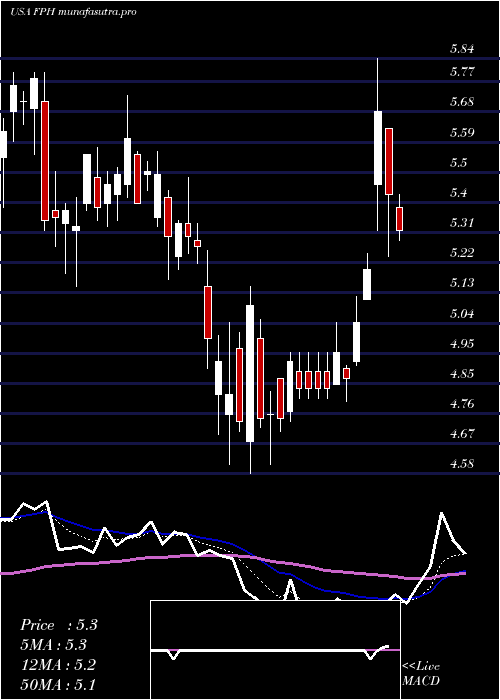
Monthly price and charts FivePoint Strong monthly Stock price targets for FivePoint FPH are 5.73 and 6.06 | Monthly Target 1 | 5.66 | | Monthly Target 2 | 5.79 | | Monthly Target 3 | 5.99 | | Monthly Target 4 | 6.12 | | Monthly Target 5 | 6.32 |
Monthly price and volumes Five Point
| Date |
Closing |
Open |
Range |
Volume |
Thu 04 December 2025 |
5.92 (-4.52%) |
6.13 |
5.86 - 6.19 |
0.1546 times |
Fri 28 November 2025 |
6.20 (5.98%) |
5.86 |
5.74 - 6.47 |
1.1544 times |
Fri 31 October 2025 |
5.85 (-4.57%) |
6.03 |
5.49 - 6.29 |
0.9534 times |
Tue 30 September 2025 |
6.13 (7.92%) |
5.59 |
5.55 - 6.64 |
0.9782 times |
Fri 29 August 2025 |
5.68 (6.57%) |
5.30 |
5.22 - 5.77 |
0.9575 times |
Thu 31 July 2025 |
5.33 (-3.09%) |
5.47 |
5.17 - 6.59 |
1.8573 times |
Mon 30 June 2025 |
5.50 (0.92%) |
5.43 |
5.27 - 5.81 |
0.8081 times |
Fri 30 May 2025 |
5.45 (3.61%) |
5.27 |
5.17 - 5.88 |
0.8858 times |
Wed 30 April 2025 |
5.26 (-1.5%) |
5.34 |
4.58 - 5.84 |
1.2154 times |
Mon 31 March 2025 |
5.34 (-4.81%) |
5.60 |
5.15 - 5.80 |
1.0354 times |
Fri 28 February 2025 |
5.61 (-14.61%) |
6.45 |
5.17 - 6.57 |
2.5123 times |

DMA SMA EMA moving averages of Five Point FPH
DMA (daily moving average) of Five Point FPH
| DMA period | DMA value | | 5 day DMA | 6.08 | | 12 day DMA | 6.15 | | 20 day DMA | 6.14 | | 35 day DMA | 6.07 | | 50 day DMA | 6.04 | | 100 day DMA | 5.91 | | 150 day DMA | 5.8 | | 200 day DMA | 5.67 | EMA (exponential moving average) of Five Point FPH
| EMA period | EMA current | EMA prev | EMA prev2 | | 5 day EMA | 6.05 | 6.12 | 6.15 | | 12 day EMA | 6.11 | 6.15 | 6.16 | | 20 day EMA | 6.1 | 6.12 | 6.13 | | 35 day EMA | 6.09 | 6.1 | 6.1 | | 50 day EMA | 6.05 | 6.06 | 6.06 |
SMA (simple moving average) of Five Point FPH
| SMA period | SMA current | SMA prev | SMA prev2 | | 5 day SMA | 6.08 | 6.13 | 6.16 | | 12 day SMA | 6.15 | 6.18 | 6.2 | | 20 day SMA | 6.14 | 6.15 | 6.14 | | 35 day SMA | 6.07 | 6.07 | 6.06 | | 50 day SMA | 6.04 | 6.05 | 6.05 | | 100 day SMA | 5.91 | 5.91 | 5.91 | | 150 day SMA | 5.8 | 5.79 | 5.79 | | 200 day SMA | 5.67 | 5.67 | 5.67 |
|
|
