FidelityNational FNF full analysis,charts,indicators,moving averages,SMA,DMA,EMA,ADX,MACD,RSIFidelity National FNF WideScreen charts, DMA,SMA,EMA technical analysis, forecast prediction, by indicators ADX,MACD,RSI,CCI USA stock exchange
operates under Finance sector & deals in Specialty Insurers
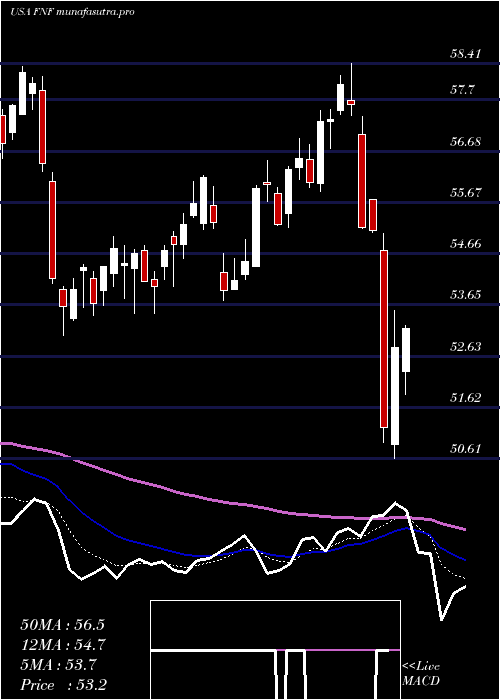
Daily price and charts and targets FidelityNational Strong Daily Stock price targets for FidelityNational FNF are 55.66 and 56.81 | Daily Target 1 | 54.74 | | Daily Target 2 | 55.42 | | Daily Target 3 | 55.886666666667 | | Daily Target 4 | 56.57 | | Daily Target 5 | 57.04 |
Daily price and volume Fidelity National
| Date |
Closing |
Open |
Range |
Volume |
Mon 20 October 2025 |
56.11 (1.57%) |
55.64 |
55.20 - 56.35 |
0.7913 times |
Fri 17 October 2025 |
55.24 (0.29%) |
55.19 |
55.00 - 55.63 |
1.1283 times |
Thu 16 October 2025 |
55.08 (-1.91%) |
55.74 |
54.60 - 55.85 |
1.0307 times |
Wed 15 October 2025 |
56.15 (-1.4%) |
56.77 |
55.96 - 56.90 |
1.3536 times |
Tue 14 October 2025 |
56.95 (3.02%) |
55.29 |
55.29 - 57.09 |
1.1227 times |
Mon 13 October 2025 |
55.28 (-2.54%) |
54.98 |
54.54 - 55.49 |
1.0087 times |
Tue 07 October 2025 |
56.72 (-2.29%) |
58.03 |
56.40 - 58.16 |
1.3061 times |
Mon 06 October 2025 |
58.05 (-3.2%) |
60.01 |
57.80 - 60.01 |
0.6007 times |
Fri 03 October 2025 |
59.97 (0.6%) |
59.57 |
59.57 - 60.30 |
1.0272 times |
Thu 02 October 2025 |
59.61 (-1.21%) |
59.87 |
59.49 - 60.16 |
0.6307 times |
Wed 01 October 2025 |
60.34 (-0.25%) |
60.51 |
60.15 - 60.74 |
1.0528 times |
Weekly price and charts FidelityNational Strong weekly Stock price targets for FidelityNational FNF are 55.66 and 56.81 | Weekly Target 1 | 54.74 | | Weekly Target 2 | 55.42 | | Weekly Target 3 | 55.886666666667 | | Weekly Target 4 | 56.57 | | Weekly Target 5 | 57.04 |
Weekly price and volumes for Fidelity National
| Date |
Closing |
Open |
Range |
Volume |
Mon 20 October 2025 |
56.11 (1.57%) |
55.64 |
55.20 - 56.35 |
0.1781 times |
Fri 17 October 2025 |
55.24 (-2.61%) |
54.98 |
54.54 - 57.09 |
1.2699 times |
Tue 07 October 2025 |
56.72 (-5.42%) |
60.01 |
56.40 - 60.01 |
0.429 times |
Fri 03 October 2025 |
59.97 (-0.73%) |
60.31 |
59.49 - 60.74 |
1.1155 times |
Fri 26 September 2025 |
60.41 (2.93%) |
58.72 |
58.34 - 60.51 |
1.1462 times |
Fri 19 September 2025 |
58.69 (-3.04%) |
60.62 |
58.24 - 60.81 |
1.9961 times |
Fri 12 September 2025 |
60.53 (-0.07%) |
60.31 |
58.89 - 60.97 |
1.362 times |
Fri 05 September 2025 |
60.57 (1.17%) |
59.07 |
58.17 - 61.40 |
1.2446 times |
Fri 29 August 2025 |
59.87 (0%) |
59.76 |
59.62 - 60.21 |
0.2308 times |
Fri 29 August 2025 |
59.87 (-1.56%) |
60.81 |
59.17 - 60.88 |
1.0277 times |
Fri 22 August 2025 |
60.82 (2.06%) |
59.52 |
58.56 - 61.34 |
1.262 times |
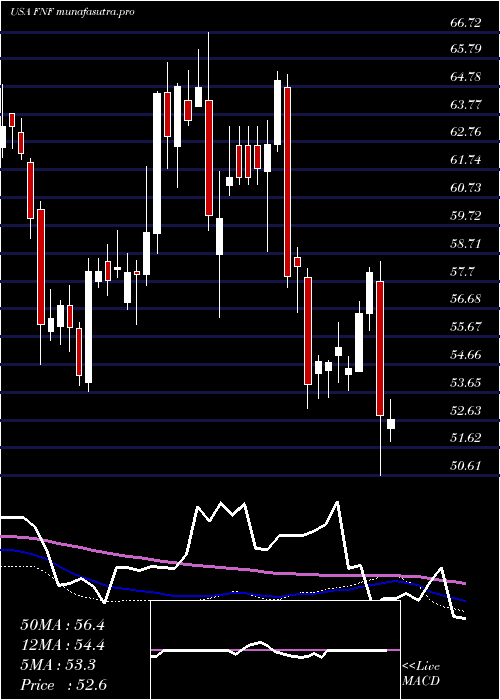
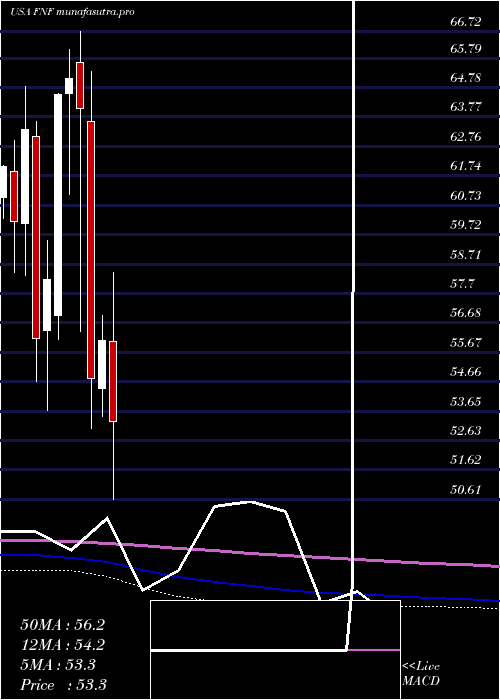
Monthly price and charts FidelityNational Strong monthly Stock price targets for FidelityNational FNF are 52.23 and 58.43 | Monthly Target 1 | 50.93 | | Monthly Target 2 | 53.52 | | Monthly Target 3 | 57.13 | | Monthly Target 4 | 59.72 | | Monthly Target 5 | 63.33 |
Monthly price and volumes Fidelity National
| Date |
Closing |
Open |
Range |
Volume |
Mon 20 October 2025 |
56.11 (-7.24%) |
60.51 |
54.54 - 60.74 |
0.3648 times |
Tue 30 September 2025 |
60.49 (1.04%) |
59.07 |
58.17 - 61.40 |
0.9175 times |
Fri 29 August 2025 |
59.87 (6.1%) |
56.56 |
56.03 - 61.34 |
0.8488 times |
Thu 31 July 2025 |
56.43 (0.66%) |
56.05 |
50.61 - 58.41 |
1.9445 times |
Mon 30 June 2025 |
56.06 (2.36%) |
54.43 |
53.47 - 56.94 |
1.1552 times |
Fri 30 May 2025 |
54.77 (-14.49%) |
63.60 |
53.05 - 65.33 |
1.0686 times |
Wed 30 April 2025 |
64.05 (-1.58%) |
65.65 |
56.38 - 66.72 |
1.1625 times |
Mon 31 March 2025 |
65.08 (0.85%) |
64.57 |
61.09 - 66.10 |
1.0542 times |
Fri 28 February 2025 |
64.53 (10.93%) |
56.93 |
56.12 - 64.58 |
0.7736 times |
Fri 31 January 2025 |
58.17 (3.62%) |
56.43 |
53.68 - 59.53 |
0.7103 times |
Tue 31 December 2024 |
56.14 (-11.34%) |
63.10 |
54.66 - 63.61 |
0.5664 times |
DMA SMA EMA moving averages of Fidelity National FNF
DMA (daily moving average) of Fidelity National FNF
| DMA period | DMA value | | 5 day DMA | 55.91 | | 12 day DMA | 57.5 | | 20 day DMA | 58.26 | | 35 day DMA | 58.92 | | 50 day DMA | 59.14 | | 100 day DMA | 57.22 | | 150 day DMA | 58.75 | | 200 day DMA | 58.71 | EMA (exponential moving average) of Fidelity National FNF
| EMA period | EMA current | EMA prev | EMA prev2 | | 5 day EMA | 55.99 | 55.93 | 56.28 | | 12 day EMA | 57 | 57.16 | 57.51 | | 20 day EMA | 57.69 | 57.86 | 58.14 | | 35 day EMA | 58.28 | 58.41 | 58.6 | | 50 day EMA | 58.65 | 58.75 | 58.89 |
SMA (simple moving average) of Fidelity National FNF
| SMA period | SMA current | SMA prev | SMA prev2 | | 5 day SMA | 55.91 | 55.74 | 56.04 | | 12 day SMA | 57.5 | 57.81 | 58.24 | | 20 day SMA | 58.26 | 58.39 | 58.55 | | 35 day SMA | 58.92 | 59.04 | 59.19 | | 50 day SMA | 59.14 | 59.18 | 59.23 | | 100 day SMA | 57.22 | 57.2 | 57.21 | | 150 day SMA | 58.75 | 58.79 | 58.83 | | 200 day SMA | 58.71 | 58.72 | 58.72 |
|
|
