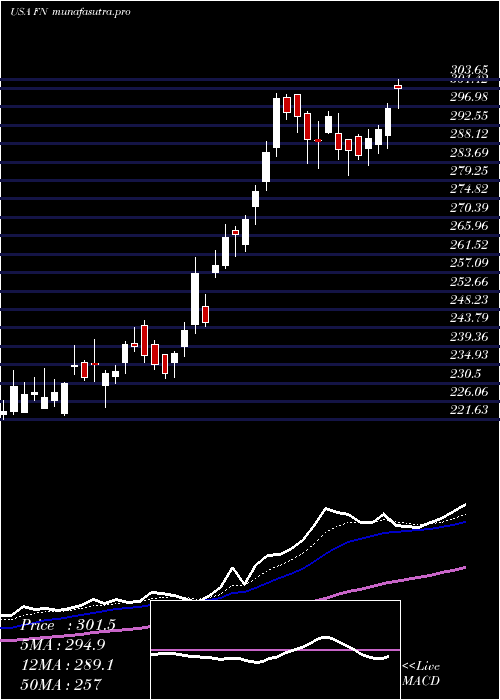
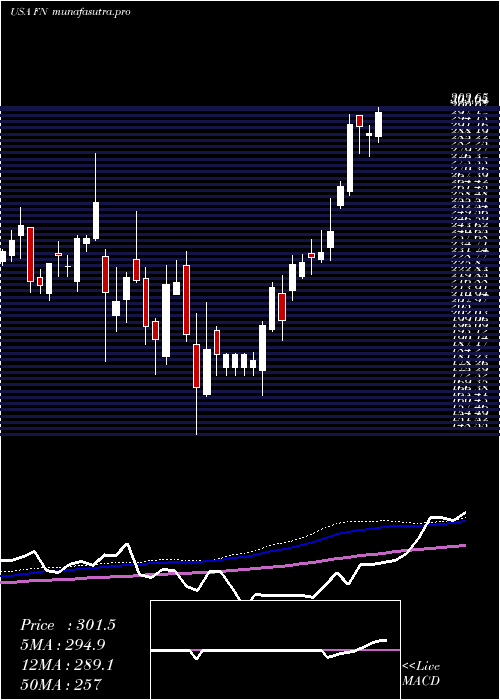
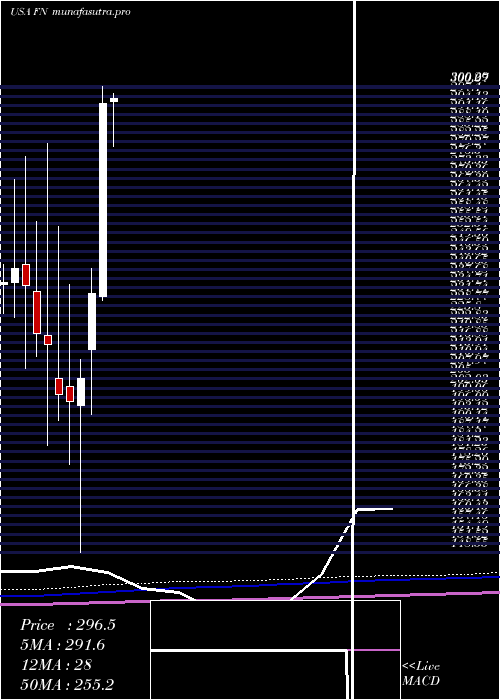
Fabrinet FN full analysis,charts,indicators,moving averages,SMA,DMA,EMA,ADX,MACD,RSIFabrinet FN WideScreen charts, DMA,SMA,EMA technical analysis, forecast prediction, by indicators ADX,MACD,RSI,CCI USA stock exchange
operates under Public Utilities sector & deals in Telecommunications Equipment
Daily price and charts and targets Fabrinet Strong Daily Stock price targets for Fabrinet FN are 401.42 and 413.02 | Daily Target 1 | 399.37 | | Daily Target 2 | 403.46 | | Daily Target 3 | 410.97 | | Daily Target 4 | 415.06 | | Daily Target 5 | 422.57 |
Daily price and volume Fabrinet
| Date |
Closing |
Open |
Range |
Volume |
Mon 20 October 2025 |
407.55 (-0.57%) |
415.00 |
406.88 - 418.48 |
0.988 times |
Fri 17 October 2025 |
409.90 (-0.62%) |
410.97 |
402.35 - 421.58 |
1.0456 times |
Thu 16 October 2025 |
412.46 (3.54%) |
412.03 |
409.17 - 432.00 |
1.9613 times |
Wed 15 October 2025 |
398.34 (6.16%) |
384.58 |
382.19 - 399.00 |
1.0414 times |
Tue 14 October 2025 |
375.24 (-1.92%) |
371.00 |
366.49 - 379.93 |
0.5608 times |
Mon 13 October 2025 |
382.60 (5.71%) |
381.56 |
370.58 - 383.77 |
0.8972 times |
Fri 10 October 2025 |
361.94 (-5.31%) |
384.72 |
361.19 - 384.72 |
1.3181 times |
Thu 09 October 2025 |
382.24 (-0.31%) |
380.68 |
372.80 - 383.76 |
0.7571 times |
Wed 08 October 2025 |
383.43 (3.58%) |
371.36 |
369.68 - 383.79 |
0.6019 times |
Tue 07 October 2025 |
370.17 (-0.03%) |
370.96 |
358.28 - 372.23 |
0.8287 times |
Mon 06 October 2025 |
370.29 (1.17%) |
366.40 |
362.90 - 380.38 |
0.5188 times |
Weekly price and charts Fabrinet Strong weekly Stock price targets for Fabrinet FN are 401.42 and 413.02 | Weekly Target 1 | 399.37 | | Weekly Target 2 | 403.46 | | Weekly Target 3 | 410.97 | | Weekly Target 4 | 415.06 | | Weekly Target 5 | 422.57 |
Weekly price and volumes for Fabrinet
| Date |
Closing |
Open |
Range |
Volume |
Mon 20 October 2025 |
407.55 (-0.57%) |
415.00 |
406.88 - 418.48 |
0.1798 times |
Fri 17 October 2025 |
409.90 (13.25%) |
381.56 |
366.49 - 432.00 |
1.0018 times |
Fri 10 October 2025 |
361.94 (-1.11%) |
366.40 |
358.28 - 384.72 |
0.7322 times |
Fri 03 October 2025 |
366.00 (1.98%) |
364.87 |
355.50 - 379.46 |
0.6756 times |
Fri 26 September 2025 |
358.90 (-6.32%) |
383.13 |
354.41 - 397.26 |
0.9246 times |
Fri 19 September 2025 |
383.13 (7.02%) |
359.12 |
348.01 - 384.48 |
1.4833 times |
Fri 12 September 2025 |
358.00 (-3.25%) |
374.50 |
356.20 - 380.01 |
1.3277 times |
Fri 05 September 2025 |
370.03 (11.69%) |
317.50 |
313.00 - 377.56 |
1.1639 times |
Fri 29 August 2025 |
331.29 (0%) |
350.22 |
327.68 - 352.50 |
0.4 times |
Fri 29 August 2025 |
331.29 (12.55%) |
303.38 |
303.10 - 360.00 |
2.1113 times |
Fri 22 August 2025 |
294.35 (-10.75%) |
328.24 |
272.49 - 331.76 |
2.4627 times |
Monthly price and charts Fabrinet Strong monthly Stock price targets for Fabrinet FN are 382.92 and 456.64 | Monthly Target 1 | 325.56 | | Monthly Target 2 | 366.55 | | Monthly Target 3 | 399.27666666667 | | Monthly Target 4 | 440.27 | | Monthly Target 5 | 473 |
Monthly price and volumes Fabrinet
| Date |
Closing |
Open |
Range |
Volume |
Mon 20 October 2025 |
407.55 (11.77%) |
360.00 |
358.28 - 432.00 |
0.4121 times |
Tue 30 September 2025 |
364.62 (10.06%) |
317.50 |
313.00 - 397.26 |
0.9409 times |
Fri 29 August 2025 |
331.29 (2.34%) |
312.56 |
272.49 - 360.00 |
1.397 times |
Thu 31 July 2025 |
323.73 (9.86%) |
295.44 |
280.57 - 332.61 |
0.7759 times |
Mon 30 June 2025 |
294.68 (26.54%) |
231.97 |
230.50 - 300.29 |
0.7338 times |
Fri 30 May 2025 |
232.87 (13.56%) |
214.59 |
193.54 - 241.00 |
1.0675 times |
Wed 30 April 2025 |
205.06 (3.82%) |
196.28 |
148.55 - 211.31 |
1.3021 times |
Mon 31 March 2025 |
197.51 (-1.27%) |
202.50 |
176.99 - 235.60 |
1.3014 times |
Fri 28 February 2025 |
200.05 (-7.47%) |
205.01 |
191.35 - 254.61 |
1.153 times |
Fri 31 January 2025 |
216.21 (-1.67%) |
219.29 |
183.31 - 281.79 |
0.9162 times |
Tue 31 December 2024 |
219.88 (-6.63%) |
233.47 |
212.31 - 256.24 |
0.4948 times |
DMA SMA EMA moving averages of Fabrinet FN
DMA (daily moving average) of Fabrinet FN
| DMA period | DMA value | | 5 day DMA | 400.7 | | 12 day DMA | 385.01 | | 20 day DMA | 377.81 | | 35 day DMA | 371.93 | | 50 day DMA | 356.24 | | 100 day DMA | 320.49 | | 150 day DMA | 281.84 | | 200 day DMA | 266.21 | EMA (exponential moving average) of Fabrinet FN
| EMA period | EMA current | EMA prev | EMA prev2 | | 5 day EMA | 401.52 | 398.51 | 392.81 | | 12 day EMA | 389.72 | 386.48 | 382.22 | | 20 day EMA | 381.85 | 379.15 | 375.92 | | 35 day EMA | 369.01 | 366.74 | 364.2 | | 50 day EMA | 358.97 | 356.99 | 354.83 |
SMA (simple moving average) of Fabrinet FN
| SMA period | SMA current | SMA prev | SMA prev2 | | 5 day SMA | 400.7 | 395.71 | 386.12 | | 12 day SMA | 385.01 | 381.85 | 378.63 | | 20 day SMA | 377.81 | 376.91 | 375.57 | | 35 day SMA | 371.93 | 369.75 | 367.5 | | 50 day SMA | 356.24 | 354.74 | 353.42 | | 100 day SMA | 320.49 | 318.76 | 316.96 | | 150 day SMA | 281.84 | 280.6 | 279.34 | | 200 day SMA | 266.21 | 265.32 | 264.37 |
|
|
