FmcCorporation FMC full analysis,charts,indicators,moving averages,SMA,DMA,EMA,ADX,MACD,RSIFmc Corporation FMC WideScreen charts, DMA,SMA,EMA technical analysis, forecast prediction, by indicators ADX,MACD,RSI,CCI USA stock exchange
operates under Basic Industries sector & deals in Major Chemicals
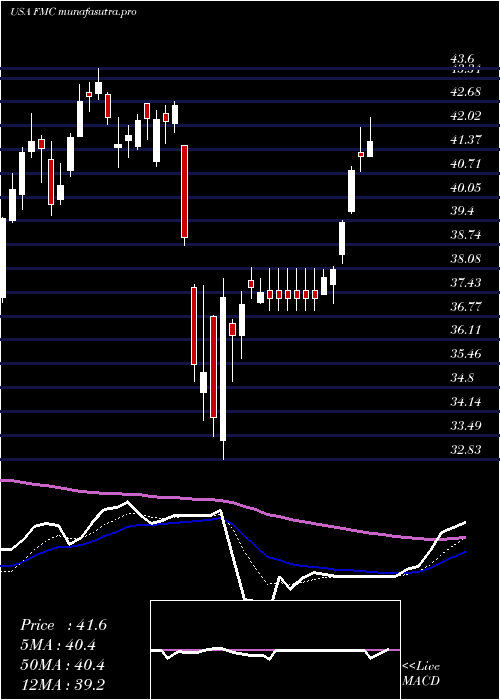
Daily price and charts and targets FmcCorporation Strong Daily Stock price targets for FmcCorporation FMC are 13.02 and 13.49 | Daily Target 1 | 12.93 | | Daily Target 2 | 13.1 | | Daily Target 3 | 13.4 | | Daily Target 4 | 13.57 | | Daily Target 5 | 13.87 |
Daily price and volume Fmc Corporation
| Date |
Closing |
Open |
Range |
Volume |
Fri 05 December 2025 |
13.27 (-0.15%) |
13.39 |
13.23 - 13.70 |
0.9384 times |
Thu 04 December 2025 |
13.29 (-2.28%) |
13.65 |
13.14 - 13.74 |
1.2029 times |
Wed 03 December 2025 |
13.60 (-0.8%) |
13.78 |
13.46 - 13.99 |
1.0653 times |
Tue 02 December 2025 |
13.71 (-0.94%) |
13.92 |
13.48 - 14.02 |
0.7058 times |
Mon 01 December 2025 |
13.84 (-3.15%) |
14.25 |
13.78 - 14.48 |
1.142 times |
Fri 28 November 2025 |
14.29 (2.44%) |
14.05 |
14.01 - 14.50 |
0.7946 times |
Wed 26 November 2025 |
13.95 (3.87%) |
13.46 |
13.36 - 14.13 |
0.7955 times |
Tue 25 November 2025 |
13.43 (1.9%) |
13.10 |
13.09 - 13.60 |
0.7547 times |
Mon 24 November 2025 |
13.18 (3.37%) |
12.94 |
12.62 - 13.22 |
0.9719 times |
Fri 21 November 2025 |
12.75 (4.68%) |
12.21 |
12.19 - 13.05 |
1.629 times |
Thu 20 November 2025 |
12.18 (-4.02%) |
12.76 |
12.17 - 12.90 |
1.3553 times |
Weekly price and charts FmcCorporation Strong weekly Stock price targets for FmcCorporation FMC are 12.54 and 13.88 | Weekly Target 1 | 12.29 | | Weekly Target 2 | 12.78 | | Weekly Target 3 | 13.63 | | Weekly Target 4 | 14.12 | | Weekly Target 5 | 14.97 |
Weekly price and volumes for Fmc Corporation
| Date |
Closing |
Open |
Range |
Volume |
Fri 05 December 2025 |
13.27 (-7.14%) |
14.25 |
13.14 - 14.48 |
0.7621 times |
Fri 28 November 2025 |
14.29 (12.08%) |
12.94 |
12.62 - 14.50 |
0.5001 times |
Fri 21 November 2025 |
12.75 (-8.27%) |
13.69 |
12.17 - 13.90 |
1.0466 times |
Fri 14 November 2025 |
13.90 (-0.64%) |
14.14 |
13.57 - 14.31 |
0.9921 times |
Fri 07 November 2025 |
13.99 (-7.78%) |
13.95 |
12.83 - 14.20 |
1.0134 times |
Fri 31 October 2025 |
15.17 (0%) |
15.01 |
14.65 - 15.39 |
0.9193 times |
Fri 31 October 2025 |
15.17 (-50.18%) |
30.61 |
14.65 - 30.95 |
3.3836 times |
Fri 24 October 2025 |
30.45 (3.57%) |
29.45 |
29.13 - 30.82 |
0.315 times |
Fri 17 October 2025 |
29.40 (1.1%) |
29.62 |
29.17 - 31.30 |
0.4992 times |
Fri 10 October 2025 |
29.08 (-9.8%) |
32.26 |
28.80 - 32.35 |
0.5686 times |
Fri 03 October 2025 |
32.24 (-4.16%) |
34.00 |
31.14 - 34.01 |
0.6144 times |
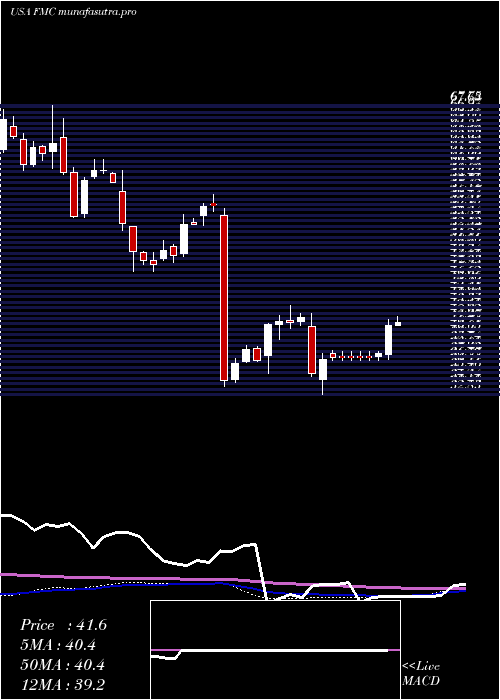
Monthly price and charts FmcCorporation Strong monthly Stock price targets for FmcCorporation FMC are 12.54 and 13.88 | Monthly Target 1 | 12.29 | | Monthly Target 2 | 12.78 | | Monthly Target 3 | 13.63 | | Monthly Target 4 | 14.12 | | Monthly Target 5 | 14.97 |
Monthly price and volumes Fmc Corporation
| Date |
Closing |
Open |
Range |
Volume |
Fri 05 December 2025 |
13.27 (-7.14%) |
14.25 |
13.14 - 14.48 |
0.3003 times |
Fri 28 November 2025 |
14.29 (-5.8%) |
13.95 |
12.17 - 14.50 |
1.3998 times |
Fri 31 October 2025 |
15.17 (-54.89%) |
33.35 |
14.65 - 33.40 |
2.4164 times |
Tue 30 September 2025 |
33.63 (-13.99%) |
38.77 |
32.68 - 38.83 |
0.7369 times |
Fri 29 August 2025 |
39.10 (0.15%) |
38.71 |
34.98 - 40.84 |
0.6218 times |
Thu 31 July 2025 |
39.04 (-6.49%) |
41.68 |
37.55 - 44.68 |
0.6586 times |
Mon 30 June 2025 |
41.75 (2.93%) |
40.54 |
39.23 - 44.78 |
0.6766 times |
Fri 30 May 2025 |
40.56 (-3.24%) |
40.58 |
34.85 - 40.99 |
0.7953 times |
Wed 30 April 2025 |
41.92 (-0.64%) |
42.35 |
32.83 - 42.69 |
0.7663 times |
Mon 31 March 2025 |
42.19 (14.34%) |
37.59 |
35.33 - 43.60 |
1.6279 times |
Fri 28 February 2025 |
36.90 (-33.85%) |
54.49 |
33.80 - 55.27 |
1.5354 times |

DMA SMA EMA moving averages of Fmc Corporation FMC
DMA (daily moving average) of Fmc Corporation FMC
| DMA period | DMA value | | 5 day DMA | 13.54 | | 12 day DMA | 13.35 | | 20 day DMA | 13.47 | | 35 day DMA | 17.84 | | 50 day DMA | 21.85 | | 100 day DMA | 30.18 | | 150 day DMA | 33.73 | | 200 day DMA | 35.13 | EMA (exponential moving average) of Fmc Corporation FMC
| EMA period | EMA current | EMA prev | EMA prev2 | | 5 day EMA | 13.46 | 13.55 | 13.68 | | 12 day EMA | 13.7 | 13.78 | 13.87 | | 20 day EMA | 14.79 | 14.95 | 15.12 | | 35 day EMA | 18.24 | 18.53 | 18.84 | | 50 day EMA | 22.07 | 22.43 | 22.8 |
SMA (simple moving average) of Fmc Corporation FMC
| SMA period | SMA current | SMA prev | SMA prev2 | | 5 day SMA | 13.54 | 13.75 | 13.88 | | 12 day SMA | 13.35 | 13.31 | 13.28 | | 20 day SMA | 13.47 | 13.45 | 13.45 | | 35 day SMA | 17.84 | 18.32 | 18.8 | | 50 day SMA | 21.85 | 22.25 | 22.67 | | 100 day SMA | 30.18 | 30.47 | 30.75 | | 150 day SMA | 33.73 | 33.89 | 34.09 | | 200 day SMA | 35.13 | 35.25 | 35.38 |
|
|
