1800 FLWS full analysis,charts,indicators,moving averages,SMA,DMA,EMA,ADX,MACD,RSI1 800 FLWS WideScreen charts, DMA,SMA,EMA technical analysis, forecast prediction, by indicators ADX,MACD,RSI,CCI USA stock exchange
operates under Consumer Services sector & deals in Other Specialty Stores
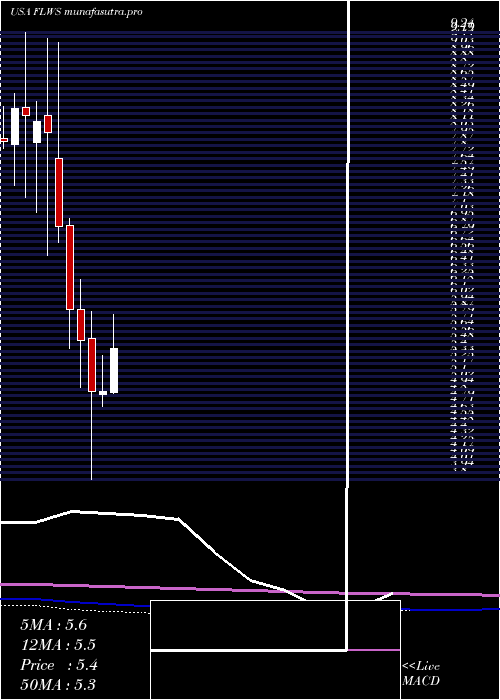
Daily price and charts and targets 1800 Strong Daily Stock price targets for 1800 FLWS are 3.43 and 3.54 | Daily Target 1 | 3.4 | | Daily Target 2 | 3.45 | | Daily Target 3 | 3.5133333333333 | | Daily Target 4 | 3.56 | | Daily Target 5 | 3.62 |
Daily price and volume 1 800
| Date |
Closing |
Open |
Range |
Volume |
Thu 04 December 2025 |
3.49 (-3.06%) |
3.58 |
3.47 - 3.58 |
0.4879 times |
Wed 03 December 2025 |
3.60 (4.65%) |
3.48 |
3.38 - 3.60 |
0.8077 times |
Tue 02 December 2025 |
3.44 (0.88%) |
3.41 |
3.40 - 3.54 |
0.6793 times |
Mon 01 December 2025 |
3.41 (0%) |
3.37 |
3.35 - 3.53 |
1.6696 times |
Fri 28 November 2025 |
3.41 (0.29%) |
3.41 |
3.39 - 3.46 |
0.3596 times |
Wed 26 November 2025 |
3.40 (4.29%) |
3.26 |
3.26 - 3.43 |
0.9632 times |
Tue 25 November 2025 |
3.26 (6.54%) |
3.07 |
3.05 - 3.33 |
1.2057 times |
Mon 24 November 2025 |
3.06 (-0.97%) |
3.09 |
3.06 - 3.17 |
0.6805 times |
Fri 21 November 2025 |
3.09 (-0.96%) |
3.11 |
3.01 - 3.17 |
1.4916 times |
Thu 20 November 2025 |
3.12 (-4.29%) |
3.30 |
3.12 - 3.40 |
1.655 times |
Wed 19 November 2025 |
3.26 (0.62%) |
3.25 |
3.21 - 3.36 |
0.9448 times |
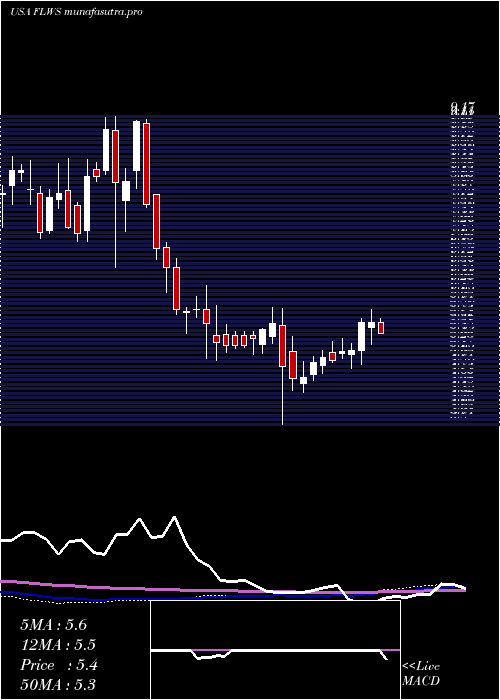
Weekly price and charts 1800 Strong weekly Stock price targets for 1800 FLWS are 3.42 and 3.67 | Weekly Target 1 | 3.23 | | Weekly Target 2 | 3.36 | | Weekly Target 3 | 3.48 | | Weekly Target 4 | 3.61 | | Weekly Target 5 | 3.73 |
Weekly price and volumes for 1 800
| Date |
Closing |
Open |
Range |
Volume |
Thu 04 December 2025 |
3.49 (2.35%) |
3.37 |
3.35 - 3.60 |
0.2545 times |
Fri 28 November 2025 |
3.41 (10.36%) |
3.09 |
3.05 - 3.46 |
0.224 times |
Fri 21 November 2025 |
3.09 (-3.13%) |
3.15 |
3.01 - 3.40 |
0.4908 times |
Fri 14 November 2025 |
3.19 (-8.6%) |
3.50 |
2.93 - 3.54 |
0.7991 times |
Fri 07 November 2025 |
3.49 (-3.06%) |
3.47 |
3.34 - 3.65 |
0.4166 times |
Fri 31 October 2025 |
3.60 (0%) |
3.59 |
3.48 - 3.79 |
0.1596 times |
Fri 31 October 2025 |
3.60 (-26.08%) |
4.95 |
3.08 - 4.95 |
1.7787 times |
Fri 24 October 2025 |
4.87 (8.22%) |
4.56 |
4.21 - 8.88 |
5.228 times |
Fri 17 October 2025 |
4.50 (6.64%) |
4.29 |
4.24 - 4.60 |
0.3337 times |
Fri 10 October 2025 |
4.22 (-7.86%) |
4.59 |
4.18 - 4.73 |
0.3148 times |
Fri 03 October 2025 |
4.58 (-3.98%) |
4.80 |
4.41 - 4.87 |
0.2888 times |
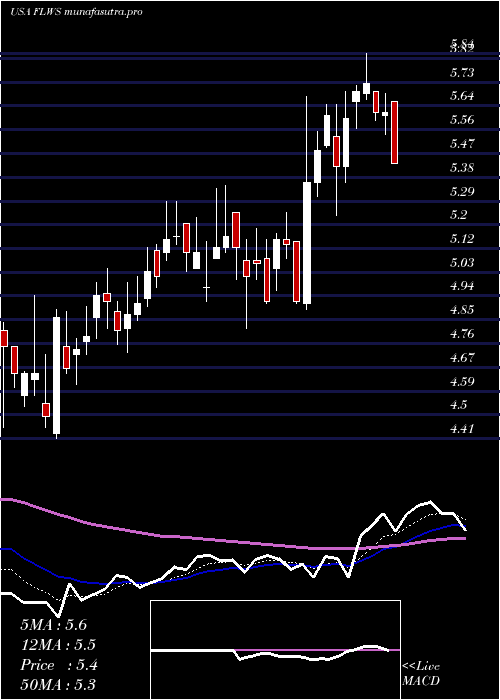
Monthly price and charts 1800 Strong monthly Stock price targets for 1800 FLWS are 3.42 and 3.67 | Monthly Target 1 | 3.23 | | Monthly Target 2 | 3.36 | | Monthly Target 3 | 3.48 | | Monthly Target 4 | 3.61 | | Monthly Target 5 | 3.73 |
Monthly price and volumes 1 800
| Date |
Closing |
Open |
Range |
Volume |
Thu 04 December 2025 |
3.49 (2.35%) |
3.37 |
3.35 - 3.60 |
0.1085 times |
Fri 28 November 2025 |
3.41 (-5.28%) |
3.47 |
2.93 - 3.65 |
0.8234 times |
Fri 31 October 2025 |
3.60 (-21.74%) |
4.61 |
3.08 - 8.88 |
3.4049 times |
Tue 30 September 2025 |
4.60 (-17.86%) |
5.46 |
4.58 - 5.86 |
0.687 times |
Fri 29 August 2025 |
5.60 (-5.25%) |
5.81 |
5.20 - 6.13 |
0.4415 times |
Thu 31 July 2025 |
5.91 (20.12%) |
4.91 |
4.89 - 8.44 |
1.1717 times |
Mon 30 June 2025 |
4.92 (0%) |
4.88 |
4.73 - 5.35 |
0.6104 times |
Fri 30 May 2025 |
4.92 (-11.03%) |
5.55 |
3.86 - 5.88 |
1.1565 times |
Wed 30 April 2025 |
5.53 (-6.27%) |
5.90 |
4.96 - 6.26 |
0.7559 times |
Mon 31 March 2025 |
5.90 (-14.49%) |
6.92 |
5.43 - 7.00 |
0.8402 times |
Fri 28 February 2025 |
6.90 (-14.07%) |
7.72 |
6.71 - 9.12 |
0.9463 times |
DMA SMA EMA moving averages of 1 800 FLWS
DMA (daily moving average) of 1 800 FLWS
| DMA period | DMA value | | 5 day DMA | 3.47 | | 12 day DMA | 3.32 | | 20 day DMA | 3.3 | | 35 day DMA | 3.64 | | 50 day DMA | 3.9 | | 100 day DMA | 4.74 | | 150 day DMA | 4.87 | | 200 day DMA | 5.17 | EMA (exponential moving average) of 1 800 FLWS
| EMA period | EMA current | EMA prev | EMA prev2 | | 5 day EMA | 3.46 | 3.45 | 3.37 | | 12 day EMA | 3.39 | 3.37 | 3.33 | | 20 day EMA | 3.44 | 3.44 | 3.42 | | 35 day EMA | 3.67 | 3.68 | 3.69 | | 50 day EMA | 3.96 | 3.98 | 4 |
SMA (simple moving average) of 1 800 FLWS
| SMA period | SMA current | SMA prev | SMA prev2 | | 5 day SMA | 3.47 | 3.45 | 3.38 | | 12 day SMA | 3.32 | 3.29 | 3.26 | | 20 day SMA | 3.3 | 3.3 | 3.29 | | 35 day SMA | 3.64 | 3.66 | 3.68 | | 50 day SMA | 3.9 | 3.93 | 3.96 | | 100 day SMA | 4.74 | 4.75 | 4.77 | | 150 day SMA | 4.87 | 4.89 | 4.9 | | 200 day SMA | 5.17 | 5.2 | 5.23 |
|
|
