FlowserveCorporation FLS full analysis,charts,indicators,moving averages,SMA,DMA,EMA,ADX,MACD,RSIFlowserve Corporation FLS WideScreen charts, DMA,SMA,EMA technical analysis, forecast prediction, by indicators ADX,MACD,RSI,CCI USA stock exchange
operates under Capital Goods sector & deals in Fluid Controls
Daily price and charts and targets FlowserveCorporation Strong Daily Stock price targets for FlowserveCorporation FLS are 71.26 and 73.31 | Daily Target 1 | 69.68 | | Daily Target 2 | 70.79 | | Daily Target 3 | 71.733333333333 | | Daily Target 4 | 72.84 | | Daily Target 5 | 73.78 |
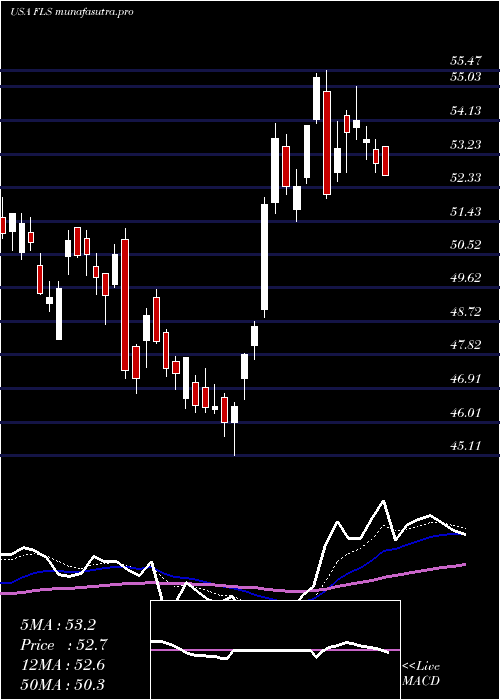
Daily price and volume Flowserve Corporation
| Date |
Closing |
Open |
Range |
Volume |
Thu 04 December 2025 |
71.89 (1.4%) |
71.00 |
70.63 - 72.68 |
1.2223 times |
Wed 03 December 2025 |
70.90 (1.34%) |
70.39 |
69.19 - 72.06 |
1.4411 times |
Tue 02 December 2025 |
69.96 (-1.28%) |
71.21 |
69.89 - 71.62 |
0.8957 times |
Mon 01 December 2025 |
70.87 (-0.67%) |
70.52 |
70.04 - 71.51 |
0.8744 times |
Fri 28 November 2025 |
71.35 (1.12%) |
70.99 |
70.51 - 71.74 |
0.3306 times |
Wed 26 November 2025 |
70.56 (0.37%) |
70.35 |
69.80 - 71.71 |
0.6819 times |
Tue 25 November 2025 |
70.30 (2.22%) |
68.92 |
68.62 - 70.48 |
0.8488 times |
Mon 24 November 2025 |
68.77 (1.51%) |
67.83 |
67.51 - 69.10 |
1.3317 times |
Fri 21 November 2025 |
67.75 (2.56%) |
65.97 |
65.47 - 67.79 |
0.9853 times |
Thu 20 November 2025 |
66.06 (-1.9%) |
68.64 |
65.68 - 69.18 |
1.3883 times |
Wed 19 November 2025 |
67.34 (2.75%) |
65.52 |
65.42 - 67.64 |
1.4723 times |
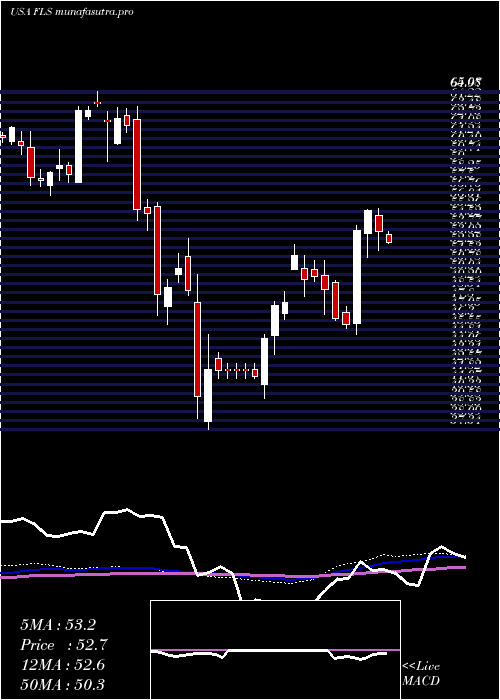
Weekly price and charts FlowserveCorporation Strong weekly Stock price targets for FlowserveCorporation FLS are 70.54 and 74.03 | Weekly Target 1 | 67.76 | | Weekly Target 2 | 69.83 | | Weekly Target 3 | 71.253333333333 | | Weekly Target 4 | 73.32 | | Weekly Target 5 | 74.74 |
Weekly price and volumes for Flowserve Corporation
| Date |
Closing |
Open |
Range |
Volume |
Thu 04 December 2025 |
71.89 (0.76%) |
70.52 |
69.19 - 72.68 |
0.6899 times |
Fri 28 November 2025 |
71.35 (5.31%) |
67.83 |
67.51 - 71.74 |
0.4969 times |
Fri 21 November 2025 |
67.75 (0.88%) |
67.13 |
64.77 - 69.18 |
1.0303 times |
Fri 14 November 2025 |
67.16 (-3%) |
70.60 |
64.69 - 71.24 |
0.8387 times |
Fri 07 November 2025 |
69.24 (1.45%) |
70.23 |
67.52 - 71.19 |
0.9417 times |
Fri 31 October 2025 |
68.25 (0%) |
67.62 |
67.08 - 68.56 |
0.3197 times |
Fri 31 October 2025 |
68.25 (27.81%) |
53.77 |
52.37 - 70.32 |
2.822 times |
Fri 24 October 2025 |
53.40 (5.68%) |
50.83 |
50.64 - 53.51 |
0.8115 times |
Fri 17 October 2025 |
50.53 (2.93%) |
50.05 |
49.10 - 51.67 |
0.9794 times |
Fri 10 October 2025 |
49.09 (-6.97%) |
53.28 |
48.71 - 53.43 |
1.07 times |
Fri 03 October 2025 |
52.77 (-2.37%) |
54.55 |
52.11 - 54.55 |
0.8532 times |
Monthly price and charts FlowserveCorporation Strong monthly Stock price targets for FlowserveCorporation FLS are 70.54 and 74.03 | Monthly Target 1 | 67.76 | | Monthly Target 2 | 69.83 | | Monthly Target 3 | 71.253333333333 | | Monthly Target 4 | 73.32 | | Monthly Target 5 | 74.74 |
Monthly price and volumes Flowserve Corporation
| Date |
Closing |
Open |
Range |
Volume |
Thu 04 December 2025 |
71.89 (0.76%) |
70.52 |
69.19 - 72.68 |
0.1452 times |
Fri 28 November 2025 |
71.35 (4.54%) |
70.23 |
64.69 - 71.74 |
0.6961 times |
Fri 31 October 2025 |
68.25 (28.43%) |
52.74 |
48.71 - 70.32 |
1.3652 times |
Tue 30 September 2025 |
53.14 (-0.97%) |
52.83 |
52.47 - 57.88 |
1.1238 times |
Fri 29 August 2025 |
53.66 (-4.25%) |
53.64 |
51.42 - 55.19 |
0.7327 times |
Thu 31 July 2025 |
56.04 (7.05%) |
51.74 |
51.42 - 59.25 |
1.7309 times |
Mon 30 June 2025 |
52.35 (4.89%) |
50.02 |
45.11 - 54.06 |
1.7216 times |
Fri 30 May 2025 |
49.91 (10.35%) |
45.79 |
45.05 - 52.50 |
0.6597 times |
Wed 30 April 2025 |
45.23 (-7.39%) |
48.54 |
37.34 - 50.03 |
0.9482 times |
Mon 31 March 2025 |
48.84 (-11.26%) |
55.68 |
45.99 - 55.96 |
0.8767 times |
Fri 28 February 2025 |
55.04 (-12.1%) |
60.84 |
53.64 - 63.86 |
0.6436 times |
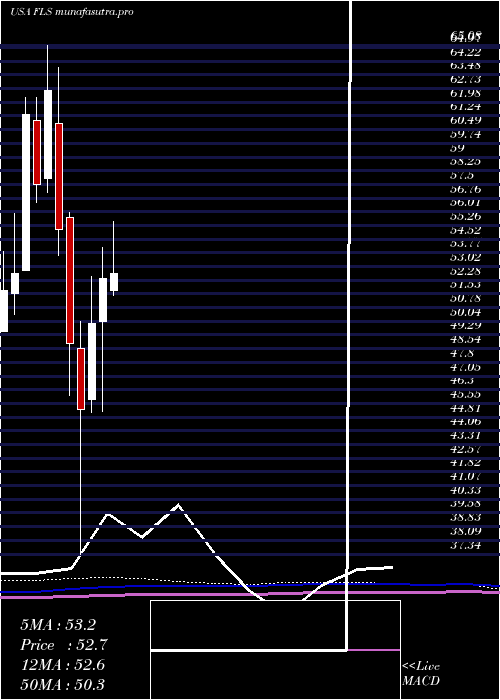
DMA SMA EMA moving averages of Flowserve Corporation FLS
DMA (daily moving average) of Flowserve Corporation FLS
| DMA period | DMA value | | 5 day DMA | 70.99 | | 12 day DMA | 69.27 | | 20 day DMA | 69 | | 35 day DMA | 64.56 | | 50 day DMA | 60.84 | | 100 day DMA | 57.68 | | 150 day DMA | 55.08 | | 200 day DMA | 53.15 | EMA (exponential moving average) of Flowserve Corporation FLS
| EMA period | EMA current | EMA prev | EMA prev2 | | 5 day EMA | 70.89 | 70.39 | 70.14 | | 12 day EMA | 69.72 | 69.33 | 69.05 | | 20 day EMA | 68.26 | 67.88 | 67.56 | | 35 day EMA | 64.93 | 64.52 | 64.14 | | 50 day EMA | 61.5 | 61.08 | 60.68 |
SMA (simple moving average) of Flowserve Corporation FLS
| SMA period | SMA current | SMA prev | SMA prev2 | | 5 day SMA | 70.99 | 70.73 | 70.61 | | 12 day SMA | 69.27 | 68.75 | 68.44 | | 20 day SMA | 69 | 68.9 | 68.83 | | 35 day SMA | 64.56 | 63.95 | 63.39 | | 50 day SMA | 60.84 | 60.51 | 60.22 | | 100 day SMA | 57.68 | 57.48 | 57.3 | | 150 day SMA | 55.08 | 54.9 | 54.73 | | 200 day SMA | 53.15 | 53.08 | 53.04 |
|
|
