Flex FLEX full analysis,charts,indicators,moving averages,SMA,DMA,EMA,ADX,MACD,RSIFlex FLEX WideScreen charts, DMA,SMA,EMA technical analysis, forecast prediction, by indicators ADX,MACD,RSI,CCI USA stock exchange
operates under Technology sector & deals in Electrical Products
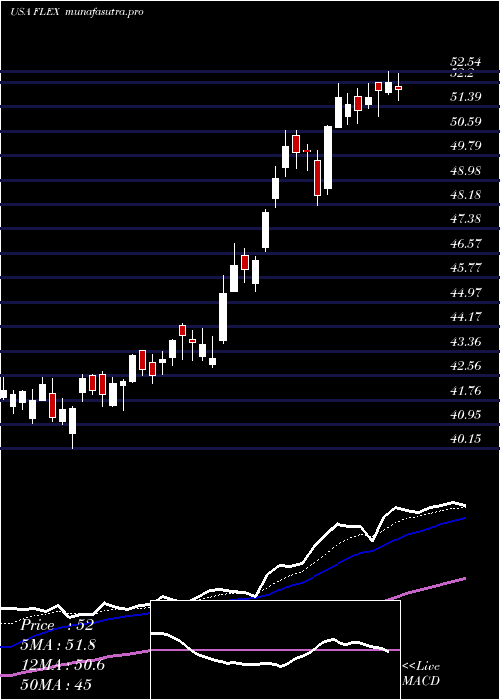
Daily price and charts and targets Flex Strong Daily Stock price targets for Flex FLEX are 61.86 and 62.97 | Daily Target 1 | 61.56 | | Daily Target 2 | 62.16 | | Daily Target 3 | 62.673333333333 | | Daily Target 4 | 63.27 | | Daily Target 5 | 63.78 |
Daily price and volume Flex
| Date |
Closing |
Open |
Range |
Volume |
Mon 20 October 2025 |
62.75 (0.98%) |
63.02 |
62.08 - 63.19 |
0.8105 times |
Fri 17 October 2025 |
62.14 (-1.89%) |
62.99 |
61.52 - 63.94 |
1.0744 times |
Thu 16 October 2025 |
63.34 (-0.41%) |
63.75 |
62.42 - 64.29 |
0.9366 times |
Wed 15 October 2025 |
63.60 (6.71%) |
60.43 |
60.35 - 63.65 |
1.4512 times |
Tue 14 October 2025 |
59.60 (1.31%) |
57.63 |
57.23 - 60.49 |
0.9737 times |
Mon 13 October 2025 |
58.83 (3.96%) |
58.44 |
57.56 - 58.93 |
0.6641 times |
Fri 10 October 2025 |
56.59 (-5.1%) |
59.80 |
56.53 - 60.00 |
0.8564 times |
Thu 09 October 2025 |
59.63 (-0.35%) |
59.70 |
58.35 - 60.00 |
1.0709 times |
Wed 08 October 2025 |
59.84 (4.52%) |
57.46 |
57.20 - 60.05 |
1.1435 times |
Tue 07 October 2025 |
57.25 (-0.05%) |
57.94 |
55.89 - 58.59 |
1.0188 times |
Mon 06 October 2025 |
57.28 (2.05%) |
57.72 |
56.79 - 58.33 |
1.2186 times |
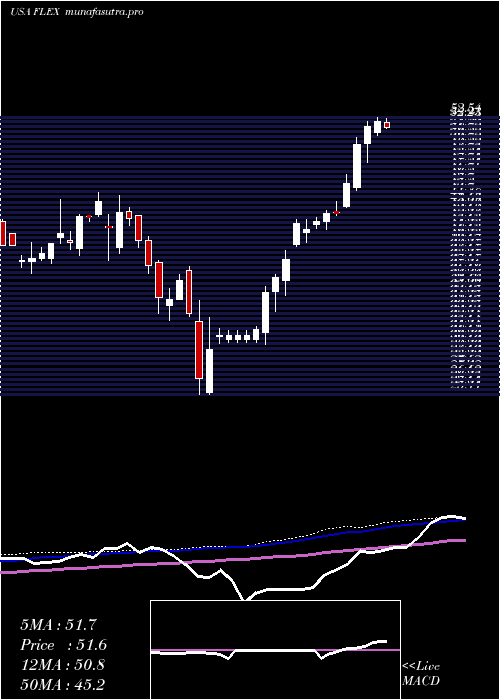
Weekly price and charts Flex Strong weekly Stock price targets for Flex FLEX are 61.86 and 62.97 | Weekly Target 1 | 61.56 | | Weekly Target 2 | 62.16 | | Weekly Target 3 | 62.673333333333 | | Weekly Target 4 | 63.27 | | Weekly Target 5 | 63.78 |
Weekly price and volumes for Flex
| Date |
Closing |
Open |
Range |
Volume |
Mon 20 October 2025 |
62.75 (0.98%) |
63.02 |
62.08 - 63.19 |
0.1818 times |
Fri 17 October 2025 |
62.14 (9.81%) |
58.44 |
57.23 - 64.29 |
1.1438 times |
Fri 10 October 2025 |
56.59 (0.82%) |
57.72 |
55.89 - 60.05 |
1.1905 times |
Fri 03 October 2025 |
56.13 (-1.27%) |
57.71 |
55.85 - 59.33 |
1.0438 times |
Fri 26 September 2025 |
56.85 (-3.07%) |
58.35 |
54.50 - 59.76 |
1.3776 times |
Fri 19 September 2025 |
58.65 (2.37%) |
57.40 |
55.35 - 58.80 |
1.3915 times |
Fri 12 September 2025 |
57.29 (2.93%) |
55.95 |
55.35 - 58.60 |
1.1841 times |
Fri 05 September 2025 |
55.66 (3.8%) |
52.44 |
51.76 - 56.58 |
0.9601 times |
Fri 29 August 2025 |
53.62 (0%) |
54.49 |
53.15 - 54.80 |
0.2205 times |
Fri 29 August 2025 |
53.62 (3.27%) |
51.89 |
51.76 - 54.83 |
1.3065 times |
Fri 22 August 2025 |
51.92 (5.96%) |
48.98 |
47.83 - 52.97 |
1.231 times |
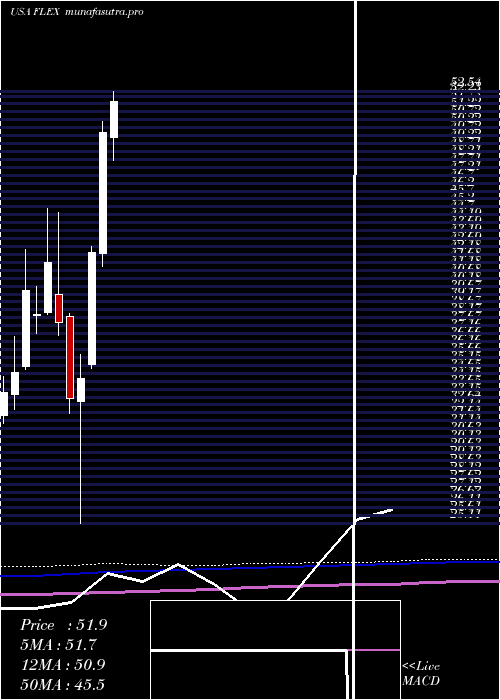
Monthly price and charts Flex Strong monthly Stock price targets for Flex FLEX are 59.3 and 67.74 | Monthly Target 1 | 52.52 | | Monthly Target 2 | 57.64 | | Monthly Target 3 | 60.963333333333 | | Monthly Target 4 | 66.08 | | Monthly Target 5 | 69.4 |
Monthly price and volumes Flex
| Date |
Closing |
Open |
Range |
Volume |
Mon 20 October 2025 |
62.75 (8.25%) |
57.25 |
55.85 - 64.29 |
0.5723 times |
Tue 30 September 2025 |
57.97 (8.11%) |
52.44 |
51.76 - 59.76 |
0.9728 times |
Fri 29 August 2025 |
53.62 (7.52%) |
48.70 |
47.83 - 54.83 |
0.9522 times |
Thu 31 July 2025 |
49.87 (-0.1%) |
49.63 |
48.15 - 53.97 |
1.1923 times |
Mon 30 June 2025 |
49.92 (18.01%) |
42.22 |
41.43 - 50.62 |
1.2954 times |
Fri 30 May 2025 |
42.30 (23.18%) |
35.18 |
34.94 - 42.70 |
1.1263 times |
Wed 30 April 2025 |
34.34 (3.81%) |
32.83 |
25.11 - 35.82 |
1.1729 times |
Mon 31 March 2025 |
33.08 (-12.69%) |
38.22 |
32.07 - 38.44 |
0.9018 times |
Fri 28 February 2025 |
37.89 (-9.03%) |
39.65 |
37.07 - 44.85 |
0.816 times |
Fri 31 January 2025 |
41.65 (8.49%) |
38.51 |
38.38 - 45.10 |
0.9979 times |
Tue 31 December 2024 |
38.39 (-3.83%) |
38.30 |
37.15 - 40.18 |
0.5714 times |
DMA SMA EMA moving averages of Flex FLEX
DMA (daily moving average) of Flex FLEX
| DMA period | DMA value | | 5 day DMA | 62.29 | | 12 day DMA | 59.75 | | 20 day DMA | 58.85 | | 35 day DMA | 57.93 | | 50 day DMA | 56 | | 100 day DMA | 52.23 | | 150 day DMA | 46.52 | | 200 day DMA | 44.93 | EMA (exponential moving average) of Flex FLEX
| EMA period | EMA current | EMA prev | EMA prev2 | | 5 day EMA | 61.98 | 61.59 | 61.32 | | 12 day EMA | 60.45 | 60.03 | 59.65 | | 20 day EMA | 59.36 | 59 | 58.67 | | 35 day EMA | 57.57 | 57.26 | 56.97 | | 50 day EMA | 56.16 | 55.89 | 55.63 |
SMA (simple moving average) of Flex FLEX
| SMA period | SMA current | SMA prev | SMA prev2 | | 5 day SMA | 62.29 | 61.5 | 60.39 | | 12 day SMA | 59.75 | 59.2 | 58.85 | | 20 day SMA | 58.85 | 58.66 | 58.48 | | 35 day SMA | 57.93 | 57.66 | 57.42 | | 50 day SMA | 56 | 55.75 | 55.52 | | 100 day SMA | 52.23 | 52.02 | 51.82 | | 150 day SMA | 46.52 | 46.34 | 46.15 | | 200 day SMA | 44.93 | 44.81 | 44.69 |
|
|
