FinancialInstitutions FISI full analysis,charts,indicators,moving averages,SMA,DMA,EMA,ADX,MACD,RSIFinancial Institutions FISI WideScreen charts, DMA,SMA,EMA technical analysis, forecast prediction, by indicators ADX,MACD,RSI,CCI USA stock exchange
operates under Finance sector & deals in Major Banks
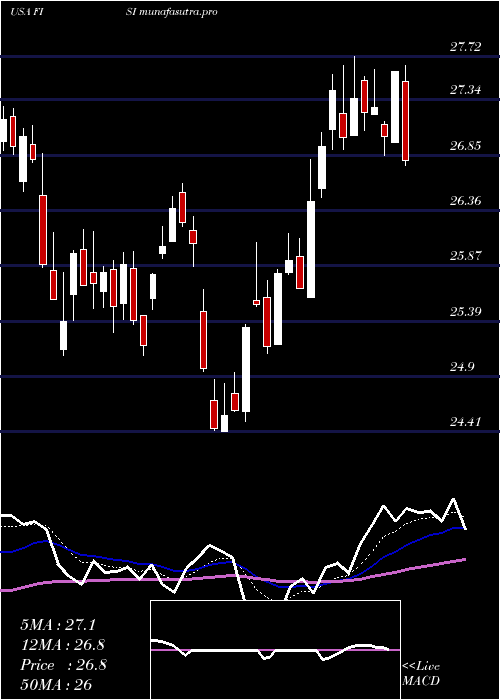
Daily price and charts and targets FinancialInstitutions Strong Daily Stock price targets for FinancialInstitutions FISI are 26.49 and 27 | Daily Target 1 | 26.11 | | Daily Target 2 | 26.36 | | Daily Target 3 | 26.623333333333 | | Daily Target 4 | 26.87 | | Daily Target 5 | 27.13 |
Daily price and volume Financial Institutions
| Date |
Closing |
Open |
Range |
Volume |
Tue 21 October 2025 |
26.60 (0.34%) |
26.42 |
26.38 - 26.89 |
0.5546 times |
Mon 20 October 2025 |
26.51 (3.07%) |
25.83 |
25.83 - 26.56 |
0.7215 times |
Fri 17 October 2025 |
25.72 (-0.54%) |
26.08 |
25.66 - 26.18 |
1.2084 times |
Thu 16 October 2025 |
25.86 (-4.15%) |
26.99 |
25.61 - 27.00 |
1.8718 times |
Wed 15 October 2025 |
26.98 (-1.86%) |
27.62 |
26.83 - 27.77 |
0.7029 times |
Tue 14 October 2025 |
27.49 (3.07%) |
26.44 |
26.44 - 27.68 |
0.79 times |
Mon 13 October 2025 |
26.67 (1.6%) |
26.73 |
26.18 - 26.73 |
0.6457 times |
Fri 10 October 2025 |
26.25 (-3.1%) |
27.18 |
26.25 - 27.53 |
1.7364 times |
Thu 09 October 2025 |
27.09 (0.18%) |
27.00 |
26.74 - 27.15 |
1.052 times |
Wed 08 October 2025 |
27.04 (-1.1%) |
27.53 |
27.01 - 27.54 |
0.7166 times |
Tue 07 October 2025 |
27.34 (-0.29%) |
27.39 |
27.30 - 27.73 |
0.8239 times |
Weekly price and charts FinancialInstitutions Strong weekly Stock price targets for FinancialInstitutions FISI are 26.22 and 27.28 | Weekly Target 1 | 25.38 | | Weekly Target 2 | 25.99 | | Weekly Target 3 | 26.44 | | Weekly Target 4 | 27.05 | | Weekly Target 5 | 27.5 |
Weekly price and volumes for Financial Institutions
| Date |
Closing |
Open |
Range |
Volume |
Tue 21 October 2025 |
26.60 (3.42%) |
25.83 |
25.83 - 26.89 |
0.3176 times |
Fri 17 October 2025 |
25.72 (-2.02%) |
26.73 |
25.61 - 27.77 |
1.2987 times |
Fri 10 October 2025 |
26.25 (-3.1%) |
27.38 |
26.25 - 27.99 |
1.3482 times |
Fri 03 October 2025 |
27.09 (-1.31%) |
27.52 |
26.72 - 27.52 |
1.5825 times |
Fri 26 September 2025 |
27.45 (1.63%) |
27.00 |
26.57 - 28.13 |
1.1198 times |
Fri 19 September 2025 |
27.01 (-0.15%) |
26.85 |
26.07 - 27.47 |
1.463 times |
Fri 12 September 2025 |
27.05 (-1.46%) |
27.51 |
26.95 - 28.03 |
0.7952 times |
Fri 05 September 2025 |
27.45 (-0.8%) |
27.33 |
27.09 - 28.04 |
0.8435 times |
Fri 29 August 2025 |
27.67 (0%) |
27.72 |
27.54 - 27.85 |
0.1284 times |
Fri 29 August 2025 |
27.67 (1.73%) |
27.18 |
27.10 - 27.85 |
1.1031 times |
Fri 22 August 2025 |
27.20 (5.51%) |
25.75 |
25.66 - 27.33 |
1.8662 times |
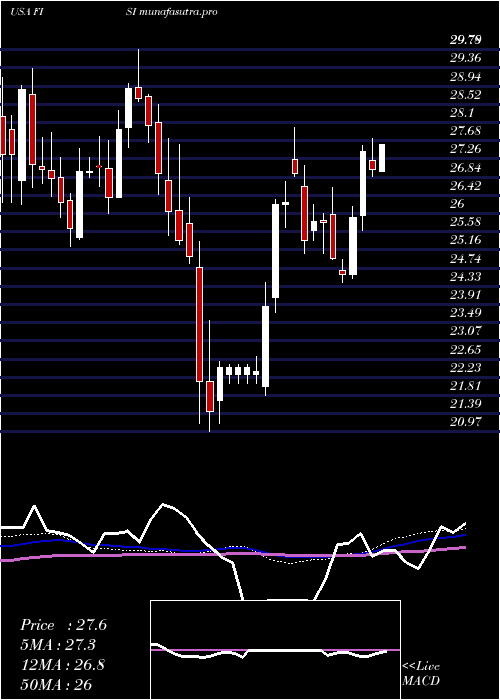
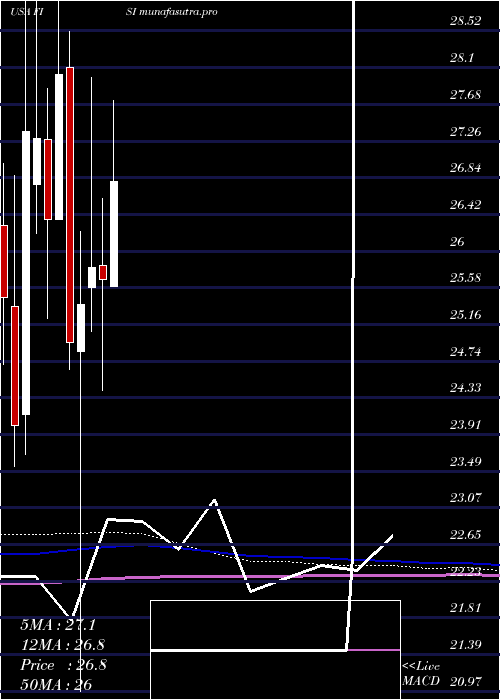
Monthly price and charts FinancialInstitutions Strong monthly Stock price targets for FinancialInstitutions FISI are 24.92 and 27.3 | Monthly Target 1 | 24.35 | | Monthly Target 2 | 25.48 | | Monthly Target 3 | 26.733333333333 | | Monthly Target 4 | 27.86 | | Monthly Target 5 | 29.11 |
Monthly price and volumes Financial Institutions
| Date |
Closing |
Open |
Range |
Volume |
Tue 21 October 2025 |
26.60 (-2.21%) |
27.01 |
25.61 - 27.99 |
0.5956 times |
Tue 30 September 2025 |
27.20 (-1.7%) |
27.33 |
26.07 - 28.13 |
0.8432 times |
Fri 29 August 2025 |
27.67 (8.55%) |
25.22 |
24.62 - 27.85 |
0.9295 times |
Thu 31 July 2025 |
25.49 (-0.74%) |
25.60 |
25.25 - 27.72 |
1.0849 times |
Mon 30 June 2025 |
25.68 (-0.54%) |
25.84 |
24.41 - 26.60 |
1.0094 times |
Fri 30 May 2025 |
25.82 (1.69%) |
25.59 |
25.08 - 27.99 |
0.6528 times |
Wed 30 April 2025 |
25.39 (1.72%) |
24.85 |
20.97 - 26.23 |
1.3728 times |
Mon 31 March 2025 |
24.96 (-10.92%) |
28.10 |
24.65 - 28.51 |
1.4451 times |
Fri 28 February 2025 |
28.02 (6.26%) |
26.37 |
26.37 - 29.79 |
0.9357 times |
Fri 31 January 2025 |
26.37 (-3.37%) |
27.28 |
25.23 - 27.86 |
1.131 times |
Tue 31 December 2024 |
27.29 (-0.29%) |
26.77 |
26.20 - 29.34 |
0.9653 times |
DMA SMA EMA moving averages of Financial Institutions FISI
DMA (daily moving average) of Financial Institutions FISI
| DMA period | DMA value | | 5 day DMA | 26.33 | | 12 day DMA | 26.75 | | 20 day DMA | 26.91 | | 35 day DMA | 27 | | 50 day DMA | 26.94 | | 100 day DMA | 26.48 | | 150 day DMA | 25.86 | | 200 day DMA | 26.22 | EMA (exponential moving average) of Financial Institutions FISI
| EMA period | EMA current | EMA prev | EMA prev2 | | 5 day EMA | 26.46 | 26.39 | 26.33 | | 12 day EMA | 26.63 | 26.64 | 26.66 | | 20 day EMA | 26.76 | 26.78 | 26.81 | | 35 day EMA | 26.76 | 26.77 | 26.79 | | 50 day EMA | 26.72 | 26.73 | 26.74 |
SMA (simple moving average) of Financial Institutions FISI
| SMA period | SMA current | SMA prev | SMA prev2 | | 5 day SMA | 26.33 | 26.51 | 26.54 | | 12 day SMA | 26.75 | 26.79 | 26.82 | | 20 day SMA | 26.91 | 26.94 | 26.95 | | 35 day SMA | 27 | 27.02 | 27.05 | | 50 day SMA | 26.94 | 26.93 | 26.89 | | 100 day SMA | 26.48 | 26.47 | 26.47 | | 150 day SMA | 25.86 | 25.86 | 25.86 | | 200 day SMA | 26.22 | 26.22 | 26.22 |
|
|
