FrankS FI full analysis,charts,indicators,moving averages,SMA,DMA,EMA,ADX,MACD,RSIFrank S FI WideScreen charts, DMA,SMA,EMA technical analysis, forecast prediction, by indicators ADX,MACD,RSI,CCI USA stock exchange
operates under Energy sector & deals in Oilfield Services Equipment
Daily price and charts and targets FrankS Strong Daily Stock price targets for FrankS FI are 123.02 and 125.91 | Daily Target 1 | 120.71 | | Daily Target 2 | 122.43 | | Daily Target 3 | 123.60333333333 | | Daily Target 4 | 125.32 | | Daily Target 5 | 126.49 |
Daily price and volume Frank S
| Date |
Closing |
Open |
Range |
Volume |
Mon 20 October 2025 |
124.14 (2.05%) |
122.29 |
121.89 - 124.78 |
0.9913 times |
Fri 17 October 2025 |
121.65 (2.59%) |
118.00 |
117.86 - 121.82 |
1.0808 times |
Thu 16 October 2025 |
118.58 (-2.09%) |
121.61 |
117.84 - 121.68 |
0.9528 times |
Wed 15 October 2025 |
121.11 (-2.43%) |
124.48 |
120.79 - 125.17 |
1.234 times |
Tue 14 October 2025 |
124.12 (1.28%) |
121.78 |
121.40 - 124.53 |
0.9826 times |
Mon 13 October 2025 |
122.55 (-0.07%) |
122.62 |
121.93 - 123.56 |
0.8812 times |
Fri 10 October 2025 |
122.63 (-2.64%) |
125.96 |
122.62 - 126.35 |
1.1263 times |
Thu 09 October 2025 |
125.96 (-0.43%) |
126.92 |
125.35 - 127.69 |
0.8903 times |
Wed 08 October 2025 |
126.51 (-0.14%) |
126.99 |
125.72 - 127.86 |
0.8098 times |
Tue 07 October 2025 |
126.69 (0.95%) |
125.51 |
125.51 - 128.35 |
1.0509 times |
Mon 06 October 2025 |
125.50 (-1.84%) |
128.46 |
125.00 - 128.54 |
1.148 times |
Weekly price and charts FrankS Strong weekly Stock price targets for FrankS FI are 123.02 and 125.91 | Weekly Target 1 | 120.71 | | Weekly Target 2 | 122.43 | | Weekly Target 3 | 123.60333333333 | | Weekly Target 4 | 125.32 | | Weekly Target 5 | 126.49 |
Weekly price and volumes for Frank S
| Date |
Closing |
Open |
Range |
Volume |
Mon 20 October 2025 |
124.14 (2.05%) |
122.29 |
121.89 - 124.78 |
0.2253 times |
Fri 17 October 2025 |
121.65 (-0.8%) |
122.62 |
117.84 - 125.17 |
1.1665 times |
Fri 10 October 2025 |
122.63 (-4.08%) |
128.46 |
122.62 - 128.54 |
1.1423 times |
Fri 03 October 2025 |
127.85 (-1.32%) |
129.57 |
124.89 - 130.64 |
1.2011 times |
Fri 26 September 2025 |
129.56 (-1.7%) |
130.83 |
128.08 - 131.97 |
1.6464 times |
Fri 19 September 2025 |
131.80 (-1.88%) |
135.20 |
130.76 - 135.88 |
1.3218 times |
Fri 12 September 2025 |
134.32 (-0.54%) |
134.60 |
131.96 - 136.60 |
1.1872 times |
Fri 05 September 2025 |
135.05 (-2.27%) |
137.57 |
134.03 - 138.62 |
0.8627 times |
Fri 29 August 2025 |
138.18 (0%) |
137.80 |
137.43 - 138.85 |
0.2146 times |
Fri 29 August 2025 |
138.18 (-1.07%) |
139.65 |
136.24 - 139.94 |
1.0321 times |
Fri 22 August 2025 |
139.68 (2.18%) |
136.65 |
135.51 - 140.42 |
1.2507 times |
Monthly price and charts FrankS Strong monthly Stock price targets for FrankS FI are 114.99 and 127 | Monthly Target 1 | 111.93 | | Monthly Target 2 | 118.04 | | Monthly Target 3 | 123.94333333333 | | Monthly Target 4 | 130.05 | | Monthly Target 5 | 135.95 |
Monthly price and volumes Frank S
| Date |
Closing |
Open |
Range |
Volume |
Mon 20 October 2025 |
124.14 (-3.72%) |
128.28 |
117.84 - 129.85 |
0.649 times |
Tue 30 September 2025 |
128.93 (-6.69%) |
137.57 |
127.41 - 138.62 |
1.1061 times |
Fri 29 August 2025 |
138.18 (-0.55%) |
138.44 |
131.06 - 140.42 |
1.0251 times |
Thu 31 July 2025 |
138.94 (-19.41%) |
171.39 |
128.22 - 175.92 |
1.5413 times |
Mon 30 June 2025 |
172.41 (5.91%) |
161.76 |
157.57 - 177.36 |
1.0281 times |
Fri 30 May 2025 |
162.79 (-11.8%) |
183.88 |
156.30 - 191.91 |
1.5685 times |
Wed 30 April 2025 |
184.57 (-16.42%) |
220.37 |
176.24 - 227.00 |
1.0194 times |
Mon 31 March 2025 |
220.83 (-6.3%) |
235.47 |
207.54 - 238.59 |
0.709 times |
Fri 28 February 2025 |
235.69 (9.1%) |
214.41 |
212.27 - 238.00 |
0.726 times |
Fri 31 January 2025 |
216.04 (5.17%) |
207.00 |
199.52 - 220.26 |
0.6276 times |
Tue 31 December 2024 |
205.42 (-7.66%) |
219.36 |
200.52 - 219.76 |
0.5222 times |
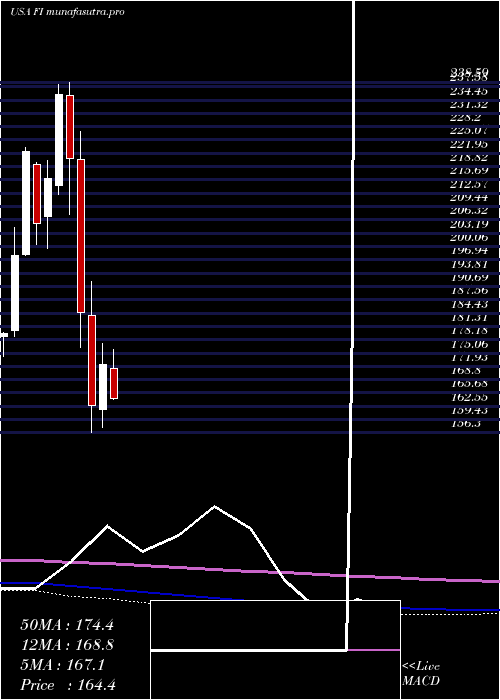
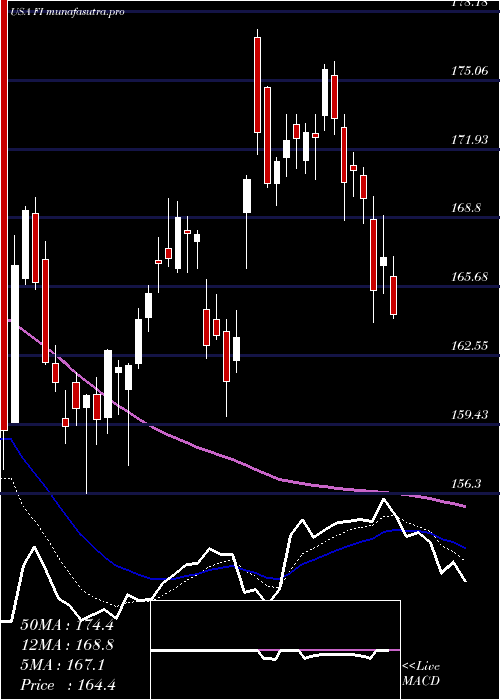
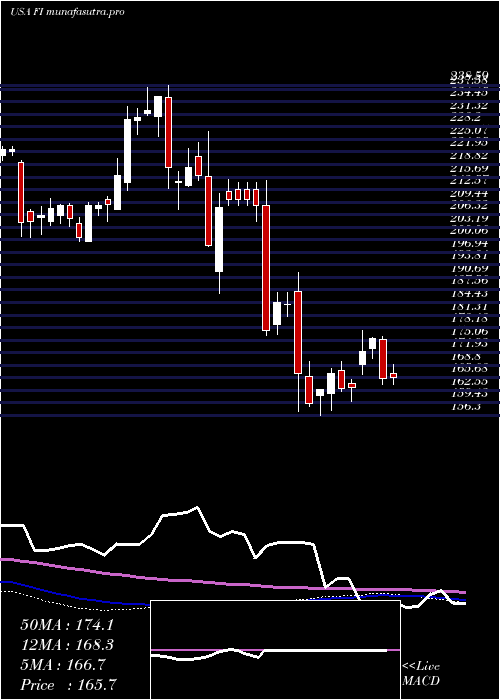
DMA SMA EMA moving averages of Frank S FI
DMA (daily moving average) of Frank S FI
| DMA period | DMA value | | 5 day DMA | 121.92 | | 12 day DMA | 123.94 | | 20 day DMA | 125.88 | | 35 day DMA | 129.45 | | 50 day DMA | 131.84 | | 100 day DMA | 145.69 | | 150 day DMA | 162.54 | | 200 day DMA | 176.54 | EMA (exponential moving average) of Frank S FI
| EMA period | EMA current | EMA prev | EMA prev2 | | 5 day EMA | 122.49 | 121.66 | 121.67 | | 12 day EMA | 123.87 | 123.82 | 124.21 | | 20 day EMA | 125.63 | 125.79 | 126.23 | | 35 day EMA | 128.29 | 128.53 | 128.93 | | 50 day EMA | 130.97 | 131.25 | 131.64 |
SMA (simple moving average) of Frank S FI
| SMA period | SMA current | SMA prev | SMA prev2 | | 5 day SMA | 121.92 | 121.6 | 121.8 | | 12 day SMA | 123.94 | 124.11 | 124.48 | | 20 day SMA | 125.88 | 126.2 | 126.7 | | 35 day SMA | 129.45 | 129.85 | 130.33 | | 50 day SMA | 131.84 | 132 | 132.23 | | 100 day SMA | 145.69 | 146.05 | 146.43 | | 150 day SMA | 162.54 | 163.14 | 163.73 | | 200 day SMA | 176.54 | 176.94 | 177.36 |
|
|
