FglHoldings FG full analysis,charts,indicators,moving averages,SMA,DMA,EMA,ADX,MACD,RSIFgl Holdings FG WideScreen charts, DMA,SMA,EMA technical analysis, forecast prediction, by indicators ADX,MACD,RSI,CCI USA stock exchange
operates under Finance sector & deals in Life Insurance
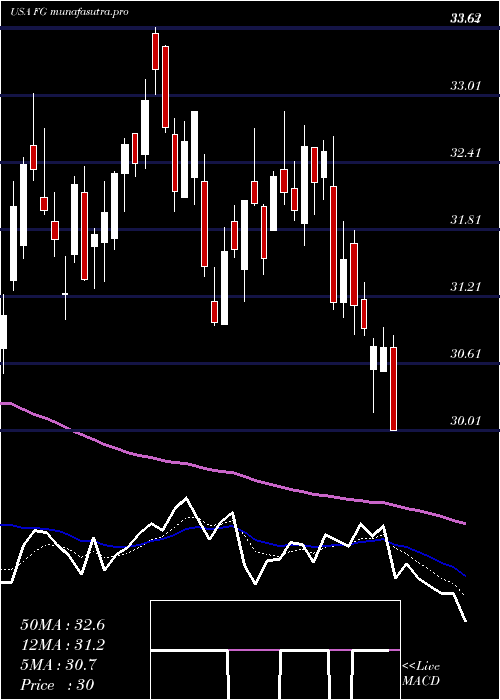
Daily price and charts and targets FglHoldings Strong Daily Stock price targets for FglHoldings FG are 29.26 and 29.87 | Daily Target 1 | 28.79 | | Daily Target 2 | 29.12 | | Daily Target 3 | 29.396666666667 | | Daily Target 4 | 29.73 | | Daily Target 5 | 30.01 |
Daily price and volume Fgl Holdings
| Date |
Closing |
Open |
Range |
Volume |
Mon 20 October 2025 |
29.46 (1.62%) |
29.06 |
29.06 - 29.67 |
0.8076 times |
Fri 17 October 2025 |
28.99 (-0.14%) |
29.03 |
28.79 - 29.09 |
0.7769 times |
Thu 16 October 2025 |
29.03 (-1.19%) |
29.24 |
28.70 - 29.40 |
1.1254 times |
Wed 15 October 2025 |
29.38 (-2.59%) |
30.11 |
29.28 - 30.13 |
0.7928 times |
Tue 14 October 2025 |
30.16 (4.32%) |
28.78 |
28.78 - 30.17 |
1.4326 times |
Mon 13 October 2025 |
28.91 (-0.89%) |
29.30 |
28.82 - 29.30 |
1.0158 times |
Fri 10 October 2025 |
29.17 (-1.69%) |
29.84 |
29.11 - 30.04 |
0.921 times |
Thu 09 October 2025 |
29.67 (-1.1%) |
30.10 |
29.59 - 30.12 |
0.7467 times |
Wed 08 October 2025 |
30.00 (-1.35%) |
30.30 |
29.82 - 30.76 |
1.2446 times |
Tue 07 October 2025 |
30.41 (-2.03%) |
30.87 |
30.19 - 31.31 |
1.1365 times |
Mon 06 October 2025 |
31.04 (-0.29%) |
31.13 |
30.93 - 31.81 |
0.7316 times |
Weekly price and charts FglHoldings Strong weekly Stock price targets for FglHoldings FG are 29.26 and 29.87 | Weekly Target 1 | 28.79 | | Weekly Target 2 | 29.12 | | Weekly Target 3 | 29.396666666667 | | Weekly Target 4 | 29.73 | | Weekly Target 5 | 30.01 |
Weekly price and volumes for Fgl Holdings
| Date |
Closing |
Open |
Range |
Volume |
Mon 20 October 2025 |
29.46 (1.62%) |
29.06 |
29.06 - 29.67 |
0.2239 times |
Fri 17 October 2025 |
28.99 (-0.62%) |
29.30 |
28.70 - 30.17 |
1.4261 times |
Fri 10 October 2025 |
29.17 (-6.3%) |
31.13 |
29.11 - 31.81 |
1.3254 times |
Fri 03 October 2025 |
31.13 (-2.41%) |
32.47 |
30.33 - 32.47 |
1.1012 times |
Fri 26 September 2025 |
31.90 (-3.3%) |
32.70 |
31.48 - 33.57 |
1.106 times |
Fri 19 September 2025 |
32.99 (-4.52%) |
34.47 |
32.95 - 34.62 |
2.0066 times |
Fri 12 September 2025 |
34.55 (0.14%) |
34.56 |
33.90 - 34.95 |
1.0647 times |
Fri 05 September 2025 |
34.50 (-0.2%) |
34.11 |
33.85 - 35.60 |
0.7755 times |
Fri 29 August 2025 |
34.57 (0%) |
34.40 |
34.33 - 34.74 |
0.1438 times |
Fri 29 August 2025 |
34.57 (-2.15%) |
35.23 |
34.07 - 35.23 |
0.8267 times |
Fri 22 August 2025 |
35.33 (2.44%) |
34.33 |
33.71 - 35.59 |
1.3932 times |
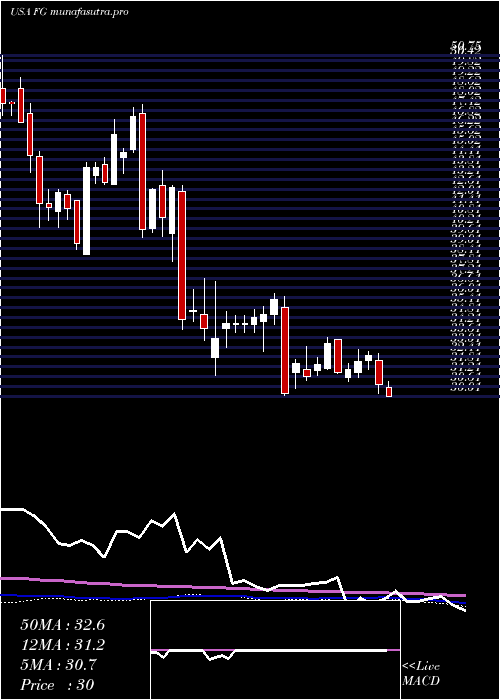
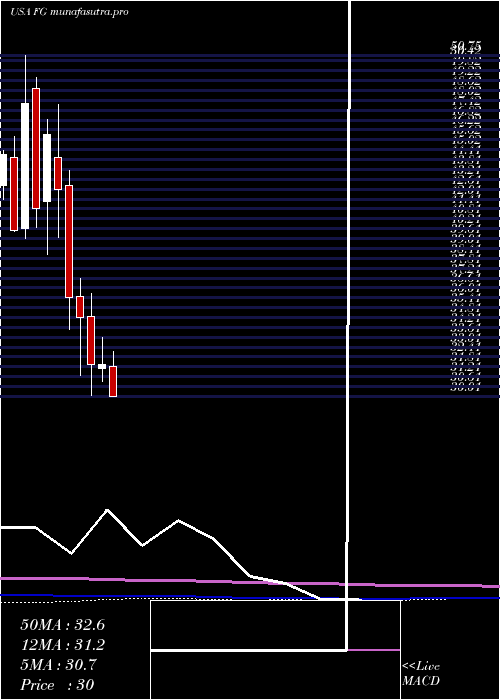
Monthly price and charts FglHoldings Strong monthly Stock price targets for FglHoldings FG are 27.53 and 30.64 | Monthly Target 1 | 26.88 | | Monthly Target 2 | 28.17 | | Monthly Target 3 | 29.99 | | Monthly Target 4 | 31.28 | | Monthly Target 5 | 33.1 |
Monthly price and volumes Fgl Holdings
| Date |
Closing |
Open |
Range |
Volume |
Mon 20 October 2025 |
29.46 (-5.79%) |
30.98 |
28.70 - 31.81 |
0.5909 times |
Tue 30 September 2025 |
31.27 (-9.55%) |
34.11 |
30.83 - 35.60 |
0.8895 times |
Fri 29 August 2025 |
34.57 (8.34%) |
31.52 |
30.60 - 36.70 |
0.8821 times |
Thu 31 July 2025 |
31.91 (-0.22%) |
31.86 |
30.01 - 32.74 |
0.8739 times |
Mon 30 June 2025 |
31.98 (0.06%) |
31.73 |
30.95 - 33.62 |
0.8978 times |
Fri 30 May 2025 |
31.96 (-8.19%) |
34.86 |
30.10 - 36.28 |
1.2955 times |
Wed 30 April 2025 |
34.81 (-3.44%) |
36.08 |
31.26 - 37.19 |
2.1477 times |
Mon 31 March 2025 |
36.05 (-15.34%) |
42.85 |
34.08 - 43.75 |
1.6434 times |
Fri 28 February 2025 |
42.58 (-7.25%) |
44.51 |
39.66 - 47.76 |
0.4269 times |
Fri 31 January 2025 |
45.91 (10.79%) |
41.84 |
38.61 - 46.82 |
0.3524 times |
Tue 31 December 2024 |
41.44 (-13.34%) |
48.73 |
40.26 - 49.41 |
0.2239 times |
DMA SMA EMA moving averages of Fgl Holdings FG
DMA (daily moving average) of Fgl Holdings FG
| DMA period | DMA value | | 5 day DMA | 29.4 | | 12 day DMA | 29.78 | | 20 day DMA | 30.52 | | 35 day DMA | 32.12 | | 50 day DMA | 32.88 | | 100 day DMA | 32.42 | | 150 day DMA | 33.14 | | 200 day DMA | 35.62 | EMA (exponential moving average) of Fgl Holdings FG
| EMA period | EMA current | EMA prev | EMA prev2 | | 5 day EMA | 29.35 | 29.29 | 29.44 | | 12 day EMA | 29.85 | 29.92 | 30.09 | | 20 day EMA | 30.51 | 30.62 | 30.79 | | 35 day EMA | 31.5 | 31.62 | 31.78 | | 50 day EMA | 32.6 | 32.73 | 32.88 |
SMA (simple moving average) of Fgl Holdings FG
| SMA period | SMA current | SMA prev | SMA prev2 | | 5 day SMA | 29.4 | 29.29 | 29.33 | | 12 day SMA | 29.78 | 29.88 | 30.03 | | 20 day SMA | 30.52 | 30.7 | 30.9 | | 35 day SMA | 32.12 | 32.26 | 32.42 | | 50 day SMA | 32.88 | 32.99 | 33.09 | | 100 day SMA | 32.42 | 32.45 | 32.47 | | 150 day SMA | 33.14 | 33.23 | 33.31 | | 200 day SMA | 35.62 | 35.68 | 35.74 |
|
|
