FlushingFinancial FFIC full analysis,charts,indicators,moving averages,SMA,DMA,EMA,ADX,MACD,RSIFlushing Financial FFIC WideScreen charts, DMA,SMA,EMA technical analysis, forecast prediction, by indicators ADX,MACD,RSI,CCI USA stock exchange
operates under Finance sector & deals in Major Banks
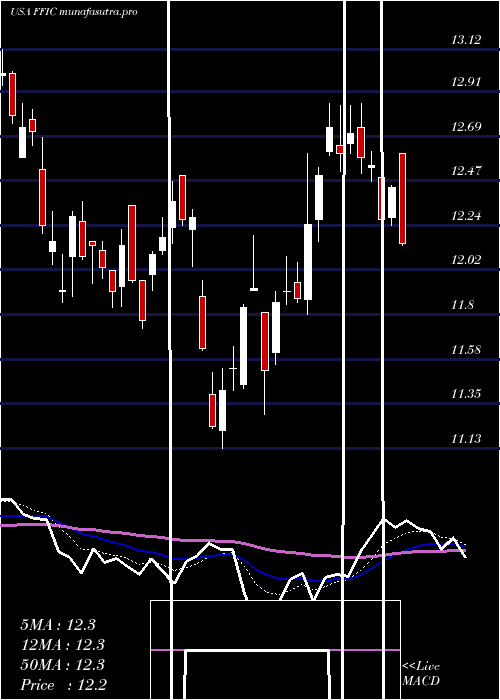
Daily price and charts and targets FlushingFinancial Strong Daily Stock price targets for FlushingFinancial FFIC are 16.8 and 17.14 | Daily Target 1 | 16.53 | | Daily Target 2 | 16.73 | | Daily Target 3 | 16.87 | | Daily Target 4 | 17.07 | | Daily Target 5 | 17.21 |
Daily price and volume Flushing Financial
| Date |
Closing |
Open |
Range |
Volume |
Thu 04 December 2025 |
16.93 (0.06%) |
16.81 |
16.67 - 17.01 |
1.2679 times |
Wed 03 December 2025 |
16.92 (1.93%) |
16.57 |
16.56 - 17.00 |
0.8461 times |
Tue 02 December 2025 |
16.60 (0.91%) |
16.45 |
16.38 - 16.61 |
0.8335 times |
Mon 01 December 2025 |
16.45 (0.24%) |
16.14 |
16.14 - 16.63 |
1.4347 times |
Fri 28 November 2025 |
16.41 (0.74%) |
16.32 |
16.11 - 16.46 |
1.1525 times |
Wed 26 November 2025 |
16.29 (-0.37%) |
16.26 |
16.18 - 16.40 |
1.0978 times |
Tue 25 November 2025 |
16.35 (3.48%) |
15.90 |
15.90 - 16.44 |
1.0134 times |
Mon 24 November 2025 |
15.80 (1.09%) |
15.59 |
15.48 - 15.83 |
0.608 times |
Fri 21 November 2025 |
15.63 (3.78%) |
15.07 |
15.07 - 15.80 |
0.8393 times |
Thu 20 November 2025 |
15.06 (-0.86%) |
15.41 |
15.04 - 15.57 |
0.9067 times |
Wed 19 November 2025 |
15.19 (-1.11%) |
15.32 |
15.08 - 15.51 |
1.3615 times |
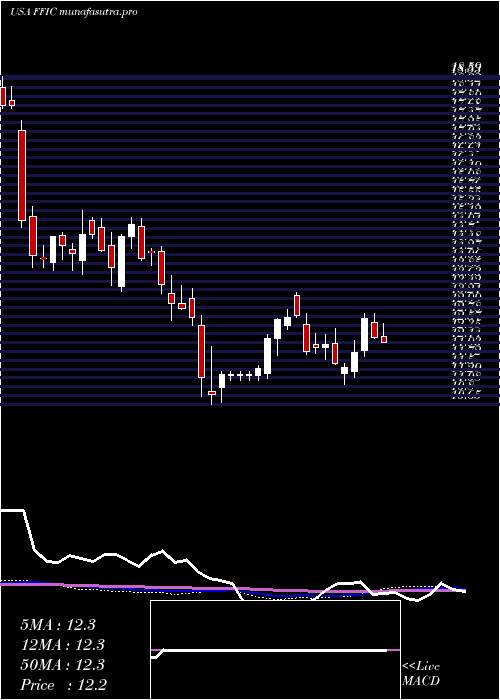
Weekly price and charts FlushingFinancial Strong weekly Stock price targets for FlushingFinancial FFIC are 16.54 and 17.41 | Weekly Target 1 | 15.82 | | Weekly Target 2 | 16.38 | | Weekly Target 3 | 16.693333333333 | | Weekly Target 4 | 17.25 | | Weekly Target 5 | 17.56 |
Weekly price and volumes for Flushing Financial
| Date |
Closing |
Open |
Range |
Volume |
Thu 04 December 2025 |
16.93 (3.17%) |
16.14 |
16.14 - 17.01 |
0.7734 times |
Fri 28 November 2025 |
16.41 (4.99%) |
15.59 |
15.48 - 16.46 |
0.6832 times |
Fri 21 November 2025 |
15.63 (1.89%) |
15.30 |
14.65 - 15.80 |
1.3906 times |
Fri 14 November 2025 |
15.34 (0.52%) |
15.33 |
13.63 - 15.57 |
0.9678 times |
Fri 07 November 2025 |
15.26 (11.63%) |
14.15 |
13.97 - 15.29 |
1.1771 times |
Fri 31 October 2025 |
13.67 (0%) |
13.41 |
13.11 - 13.74 |
0.2896 times |
Fri 31 October 2025 |
13.67 (3.4%) |
13.24 |
12.75 - 13.74 |
1.1708 times |
Fri 24 October 2025 |
13.22 (5.25%) |
12.69 |
12.57 - 13.42 |
1.2085 times |
Fri 17 October 2025 |
12.56 (-6.34%) |
13.60 |
12.46 - 13.93 |
1.1096 times |
Fri 10 October 2025 |
13.41 (-2.54%) |
13.85 |
13.34 - 14.18 |
1.2293 times |
Fri 03 October 2025 |
13.76 (-1.43%) |
14.12 |
13.55 - 14.12 |
0.7696 times |
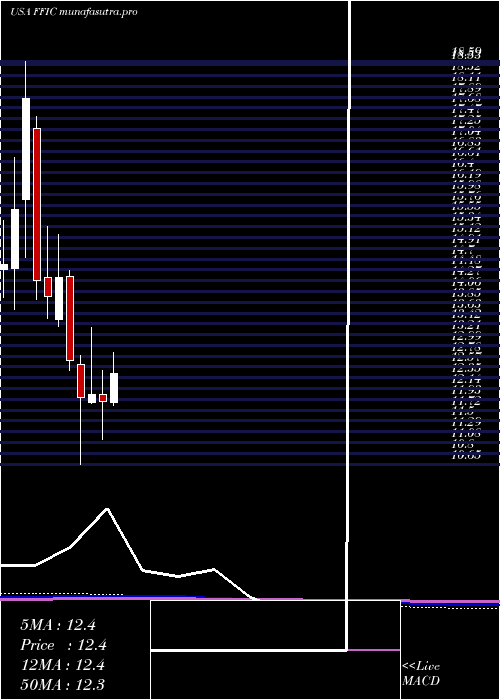
Monthly price and charts FlushingFinancial Strong monthly Stock price targets for FlushingFinancial FFIC are 16.54 and 17.41 | Monthly Target 1 | 15.82 | | Monthly Target 2 | 16.38 | | Monthly Target 3 | 16.693333333333 | | Monthly Target 4 | 17.25 | | Monthly Target 5 | 17.56 |
Monthly price and volumes Flushing Financial
| Date |
Closing |
Open |
Range |
Volume |
Thu 04 December 2025 |
16.93 (3.17%) |
16.14 |
16.14 - 17.01 |
0.1823 times |
Fri 28 November 2025 |
16.41 (20.04%) |
14.15 |
13.63 - 16.46 |
0.9943 times |
Fri 31 October 2025 |
13.67 (-1.01%) |
13.70 |
12.46 - 14.18 |
1.3008 times |
Tue 30 September 2025 |
13.81 (0.36%) |
13.59 |
13.27 - 14.41 |
0.9115 times |
Fri 29 August 2025 |
13.76 (14.76%) |
11.81 |
11.57 - 13.83 |
0.9104 times |
Thu 31 July 2025 |
11.99 (0.93%) |
11.87 |
11.75 - 12.85 |
1.3797 times |
Mon 30 June 2025 |
11.88 (-1.25%) |
12.02 |
11.13 - 12.49 |
0.9065 times |
Fri 30 May 2025 |
12.03 (0.5%) |
11.87 |
11.84 - 13.35 |
0.7806 times |
Wed 30 April 2025 |
11.97 (-5.75%) |
12.61 |
10.65 - 12.80 |
1.1769 times |
Mon 31 March 2025 |
12.70 (-11.37%) |
14.35 |
12.50 - 14.47 |
1.457 times |
Fri 28 February 2025 |
14.33 (2.72%) |
13.51 |
13.37 - 15.18 |
0.9539 times |
DMA SMA EMA moving averages of Flushing Financial FFIC
DMA (daily moving average) of Flushing Financial FFIC
| DMA period | DMA value | | 5 day DMA | 16.66 | | 12 day DMA | 16.08 | | 20 day DMA | 15.7 | | 35 day DMA | 14.67 | | 50 day DMA | 14.4 | | 100 day DMA | 13.74 | | 150 day DMA | 13.26 | | 200 day DMA | 13.11 | EMA (exponential moving average) of Flushing Financial FFIC
| EMA period | EMA current | EMA prev | EMA prev2 | | 5 day EMA | 16.67 | 16.54 | 16.35 | | 12 day EMA | 16.18 | 16.04 | 15.88 | | 20 day EMA | 15.73 | 15.6 | 15.46 | | 35 day EMA | 15.18 | 15.08 | 14.97 | | 50 day EMA | 14.61 | 14.52 | 14.42 |
SMA (simple moving average) of Flushing Financial FFIC
| SMA period | SMA current | SMA prev | SMA prev2 | | 5 day SMA | 16.66 | 16.53 | 16.42 | | 12 day SMA | 16.08 | 15.91 | 15.78 | | 20 day SMA | 15.7 | 15.59 | 15.45 | | 35 day SMA | 14.67 | 14.58 | 14.49 | | 50 day SMA | 14.4 | 14.34 | 14.28 | | 100 day SMA | 13.74 | 13.7 | 13.65 | | 150 day SMA | 13.26 | 13.23 | 13.2 | | 200 day SMA | 13.11 | 13.1 | 13.09 |
|
|
