FourSeasons FEDU full analysis,charts,indicators,moving averages,SMA,DMA,EMA,ADX,MACD,RSIFour Seasons FEDU WideScreen charts, DMA,SMA,EMA technical analysis, forecast prediction, by indicators ADX,MACD,RSI,CCI USA stock exchange
operates under Consumer Services sector & deals in Other Consumer Services
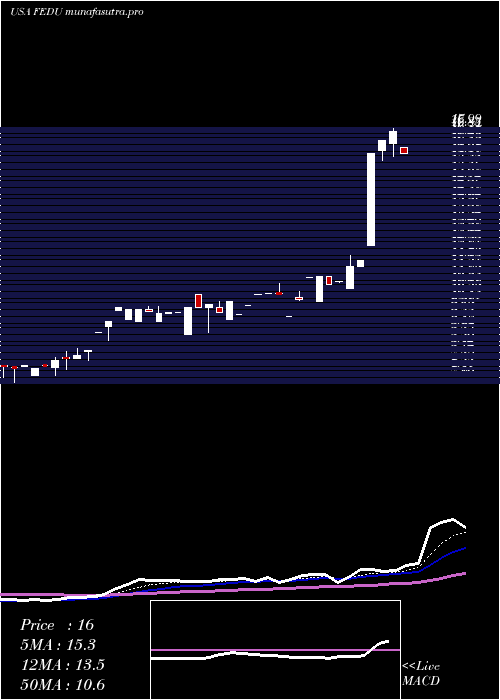
Daily price and charts and targets FourSeasons Strong Daily Stock price targets for FourSeasons FEDU are 13.98 and 14 | Daily Target 1 | 13.96 | | Daily Target 2 | 13.98 | | Daily Target 3 | 13.983333333333 | | Daily Target 4 | 14 | | Daily Target 5 | 14 |
Daily price and volume Four Seasons
| Date |
Closing |
Open |
Range |
Volume |
Fri 17 October 2025 |
13.99 (3.55%) |
13.97 |
13.97 - 13.99 |
1.3088 times |
Wed 15 October 2025 |
13.51 (-3.36%) |
13.50 |
13.50 - 13.51 |
0.1636 times |
Tue 14 October 2025 |
13.98 (7.54%) |
14.00 |
13.50 - 14.00 |
1.636 times |
Mon 13 October 2025 |
13.00 (-2.62%) |
13.01 |
13.00 - 13.99 |
0.818 times |
Thu 09 October 2025 |
13.35 (-0.15%) |
13.22 |
13.00 - 13.35 |
2.3722 times |
Wed 08 October 2025 |
13.37 (-0.07%) |
13.37 |
13.37 - 13.37 |
0.0818 times |
Tue 07 October 2025 |
13.38 (-2.62%) |
13.38 |
13.38 - 13.38 |
0.3272 times |
Mon 06 October 2025 |
13.74 (-4.18%) |
13.74 |
13.74 - 13.74 |
0.184 times |
Tue 30 September 2025 |
14.34 (4.52%) |
13.71 |
13.47 - 14.35 |
1.227 times |
Thu 25 September 2025 |
13.72 (-2.76%) |
13.00 |
13.00 - 14.36 |
1.8814 times |
Tue 23 September 2025 |
14.11 (-0.98%) |
14.64 |
14.10 - 14.65 |
14.7239 times |
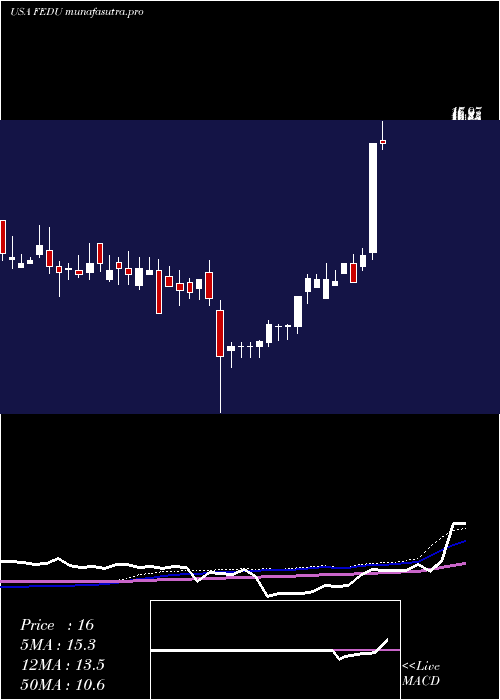
Weekly price and charts FourSeasons Strong weekly Stock price targets for FourSeasons FEDU are 13.5 and 14.5 | Weekly Target 1 | 12.66 | | Weekly Target 2 | 13.33 | | Weekly Target 3 | 13.663333333333 | | Weekly Target 4 | 14.33 | | Weekly Target 5 | 14.66 |
Weekly price and volumes for Four Seasons
| Date |
Closing |
Open |
Range |
Volume |
Fri 17 October 2025 |
13.99 (4.79%) |
13.01 |
13.00 - 14.00 |
0.3406 times |
Thu 09 October 2025 |
13.35 (-6.9%) |
13.74 |
13.00 - 13.74 |
0.2572 times |
Tue 30 September 2025 |
14.34 (4.52%) |
13.71 |
13.47 - 14.35 |
0.1064 times |
Thu 25 September 2025 |
13.72 (-3.72%) |
14.64 |
13.00 - 14.65 |
1.4404 times |
Fri 19 September 2025 |
14.25 (4.47%) |
14.50 |
11.00 - 17.24 |
2.5118 times |
Thu 11 September 2025 |
13.64 (-5.93%) |
14.15 |
13.49 - 14.93 |
0.4044 times |
Fri 05 September 2025 |
14.50 (0.69%) |
13.51 |
11.00 - 16.00 |
3.4129 times |
Fri 29 August 2025 |
14.40 (0%) |
14.50 |
14.40 - 15.00 |
0.22 times |
Fri 29 August 2025 |
14.40 (-6.49%) |
13.75 |
13.75 - 17.30 |
1.263 times |
Tue 19 August 2025 |
15.40 (-3.45%) |
15.30 |
15.30 - 15.40 |
0.0433 times |
Mon 11 August 2025 |
15.95 (11%) |
16.35 |
15.91 - 16.35 |
0.1632 times |
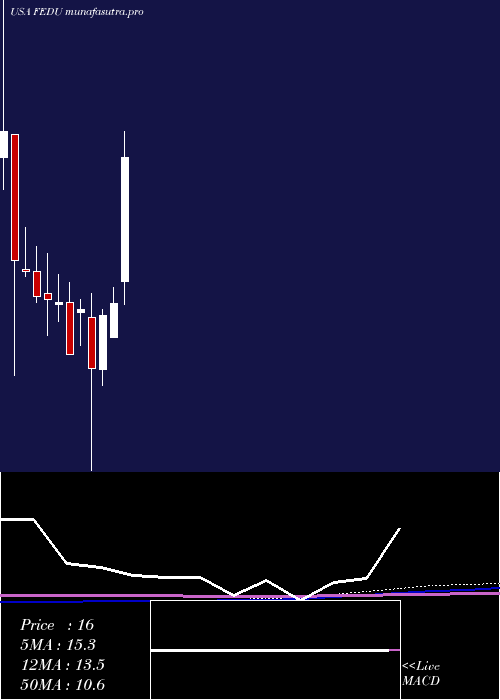
Monthly price and charts FourSeasons Strong monthly Stock price targets for FourSeasons FEDU are 13.5 and 14.5 | Monthly Target 1 | 12.66 | | Monthly Target 2 | 13.33 | | Monthly Target 3 | 13.663333333333 | | Monthly Target 4 | 14.33 | | Monthly Target 5 | 14.66 |
Monthly price and volumes Four Seasons
| Date |
Closing |
Open |
Range |
Volume |
Fri 17 October 2025 |
13.99 (-2.44%) |
13.74 |
13.00 - 14.00 |
0.1036 times |
Tue 30 September 2025 |
14.34 (-0.42%) |
13.51 |
11.00 - 17.24 |
1.3645 times |
Fri 29 August 2025 |
14.40 (2.86%) |
13.35 |
13.28 - 17.30 |
0.3234 times |
Wed 30 July 2025 |
14.00 (36.32%) |
11.13 |
10.20 - 17.00 |
0.6591 times |
Mon 30 June 2025 |
10.27 (5.23%) |
8.93 |
8.93 - 10.90 |
0.1635 times |
Fri 30 May 2025 |
9.76 (26.75%) |
7.65 |
7.02 - 10.01 |
0.4647 times |
Wed 30 April 2025 |
7.70 (-23.08%) |
9.70 |
3.69 - 10.63 |
3.9768 times |
Mon 31 March 2025 |
10.01 (21.63%) |
9.90 |
8.60 - 10.39 |
0.9891 times |
Fri 28 February 2025 |
8.23 (-20.02%) |
10.30 |
8.23 - 11.06 |
0.7868 times |
Thu 30 January 2025 |
10.29 (-1.06%) |
10.20 |
9.53 - 11.40 |
1.1686 times |
Tue 31 December 2024 |
10.40 (-1.23%) |
10.65 |
9.00 - 12.23 |
0.4124 times |
DMA SMA EMA moving averages of Four Seasons FEDU
DMA (daily moving average) of Four Seasons FEDU
| DMA period | DMA value | | 5 day DMA | 13.57 | | 12 day DMA | 13.73 | | 20 day DMA | 13.9 | | 35 day DMA | 14.16 | | 50 day DMA | 14.18 | | 100 day DMA | 11.31 | | 150 day DMA | 10.84 | | 200 day DMA | 10.89 | EMA (exponential moving average) of Four Seasons FEDU
| EMA period | EMA current | EMA prev | EMA prev2 | | 5 day EMA | 13.7 | 13.55 | 13.57 | | 12 day EMA | 13.74 | 13.7 | 13.73 | | 20 day EMA | 13.83 | 13.81 | 13.84 | | 35 day EMA | 13.83 | 13.82 | 13.84 | | 50 day EMA | 13.83 | 13.82 | 13.83 |
SMA (simple moving average) of Four Seasons FEDU
| SMA period | SMA current | SMA prev | SMA prev2 | | 5 day SMA | 13.57 | 13.44 | 13.42 | | 12 day SMA | 13.73 | 13.74 | 13.85 | | 20 day SMA | 13.9 | 13.92 | 13.98 | | 35 day SMA | 14.16 | 14.18 | 14.22 | | 50 day SMA | 14.18 | 14.13 | 14.06 | | 100 day SMA | 11.31 | 11.25 | 11.21 | | 150 day SMA | 10.84 | 10.82 | 10.8 | | 200 day SMA | 10.89 | 10.88 | 10.87 |
|
|
