FedexCorporation FDX full analysis,charts,indicators,moving averages,SMA,DMA,EMA,ADX,MACD,RSIFedex Corporation FDX WideScreen charts, DMA,SMA,EMA technical analysis, forecast prediction, by indicators ADX,MACD,RSI,CCI USA stock exchange
operates under Transportation sector & deals in Air Freight Delivery Services
Daily price and charts and targets FedexCorporation Strong Daily Stock price targets for FedexCorporation FDX are 238.79 and 242.62 | Daily Target 1 | 235.9 | | Daily Target 2 | 237.85 | | Daily Target 3 | 239.72666666667 | | Daily Target 4 | 241.68 | | Daily Target 5 | 243.56 |
Daily price and volume Fedex Corporation
| Date |
Closing |
Open |
Range |
Volume |
Mon 20 October 2025 |
239.81 (0.85%) |
238.18 |
237.77 - 241.60 |
0.6321 times |
Fri 17 October 2025 |
237.80 (0.76%) |
236.91 |
236.06 - 239.90 |
1.1264 times |
Thu 16 October 2025 |
236.00 (0.08%) |
236.50 |
233.00 - 239.00 |
0.6433 times |
Wed 15 October 2025 |
235.80 (0.48%) |
235.49 |
231.32 - 237.47 |
1.0285 times |
Tue 14 October 2025 |
234.67 (2.19%) |
228.00 |
227.01 - 235.10 |
0.8689 times |
Mon 13 October 2025 |
229.65 (2.23%) |
227.16 |
226.13 - 230.74 |
0.9561 times |
Fri 10 October 2025 |
224.63 (-5.22%) |
238.51 |
224.61 - 238.65 |
1.7238 times |
Thu 09 October 2025 |
237.00 (-1.22%) |
241.51 |
235.72 - 242.60 |
0.8878 times |
Wed 08 October 2025 |
239.93 (-0.99%) |
238.19 |
237.00 - 242.36 |
1.1582 times |
Tue 07 October 2025 |
242.33 (-1.9%) |
247.68 |
242.22 - 248.87 |
0.9748 times |
Mon 06 October 2025 |
247.03 (0.99%) |
244.53 |
243.61 - 250.09 |
0.917 times |
Weekly price and charts FedexCorporation Strong weekly Stock price targets for FedexCorporation FDX are 238.79 and 242.62 | Weekly Target 1 | 235.9 | | Weekly Target 2 | 237.85 | | Weekly Target 3 | 239.72666666667 | | Weekly Target 4 | 241.68 | | Weekly Target 5 | 243.56 |
Weekly price and volumes for Fedex Corporation
| Date |
Closing |
Open |
Range |
Volume |
Mon 20 October 2025 |
239.81 (0.85%) |
238.18 |
237.77 - 241.60 |
0.1102 times |
Fri 17 October 2025 |
237.80 (5.86%) |
227.16 |
226.13 - 239.90 |
0.8058 times |
Fri 10 October 2025 |
224.63 (-8.17%) |
244.53 |
224.61 - 250.09 |
0.9867 times |
Fri 03 October 2025 |
244.61 (2.86%) |
239.04 |
231.90 - 245.66 |
0.8725 times |
Fri 26 September 2025 |
237.82 (2.62%) |
230.01 |
225.45 - 242.00 |
1.5393 times |
Fri 19 September 2025 |
231.75 (0.96%) |
231.72 |
224.37 - 235.32 |
2.6936 times |
Fri 12 September 2025 |
229.55 (0.8%) |
226.99 |
222.06 - 230.95 |
1.03 times |
Fri 05 September 2025 |
227.72 (-1.45%) |
225.99 |
221.31 - 229.66 |
0.8929 times |
Fri 29 August 2025 |
231.07 (0%) |
231.54 |
229.97 - 233.16 |
0.1832 times |
Fri 29 August 2025 |
231.07 (-2.42%) |
235.92 |
228.03 - 237.00 |
0.8859 times |
Fri 22 August 2025 |
236.80 (4.2%) |
225.28 |
223.75 - 238.09 |
0.8872 times |
Monthly price and charts FedexCorporation Strong monthly Stock price targets for FedexCorporation FDX are 232.21 and 257.69 | Monthly Target 1 | 212.69 | | Monthly Target 2 | 226.25 | | Monthly Target 3 | 238.17 | | Monthly Target 4 | 251.73 | | Monthly Target 5 | 263.65 |
Monthly price and volumes Fedex Corporation
| Date |
Closing |
Open |
Range |
Volume |
Mon 20 October 2025 |
239.81 (1.7%) |
235.01 |
224.61 - 250.09 |
0.5055 times |
Tue 30 September 2025 |
235.81 (2.05%) |
225.99 |
221.31 - 242.00 |
1.3478 times |
Fri 29 August 2025 |
231.07 (3.39%) |
221.83 |
216.14 - 238.09 |
0.9009 times |
Thu 31 July 2025 |
223.49 (-1.68%) |
226.40 |
220.98 - 245.76 |
1.1401 times |
Mon 30 June 2025 |
227.31 (4.22%) |
217.58 |
214.82 - 232.69 |
1.2903 times |
Fri 30 May 2025 |
218.10 (3.69%) |
210.32 |
207.84 - 238.41 |
0.982 times |
Wed 30 April 2025 |
210.33 (-13.72%) |
244.00 |
194.30 - 245.72 |
0.9699 times |
Mon 31 March 2025 |
243.78 (-7.27%) |
263.62 |
217.22 - 265.00 |
1.1162 times |
Fri 28 February 2025 |
262.90 (-0.74%) |
257.54 |
244.45 - 269.44 |
0.8322 times |
Fri 31 January 2025 |
264.87 (-5.85%) |
281.54 |
263.30 - 281.98 |
0.915 times |
Tue 31 December 2024 |
281.33 (-7.15%) |
294.50 |
265.09 - 295.24 |
0.8752 times |

DMA SMA EMA moving averages of Fedex Corporation FDX
DMA (daily moving average) of Fedex Corporation FDX
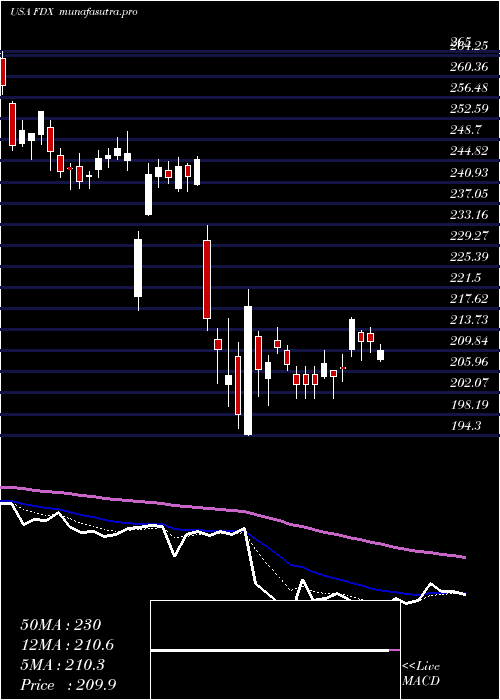
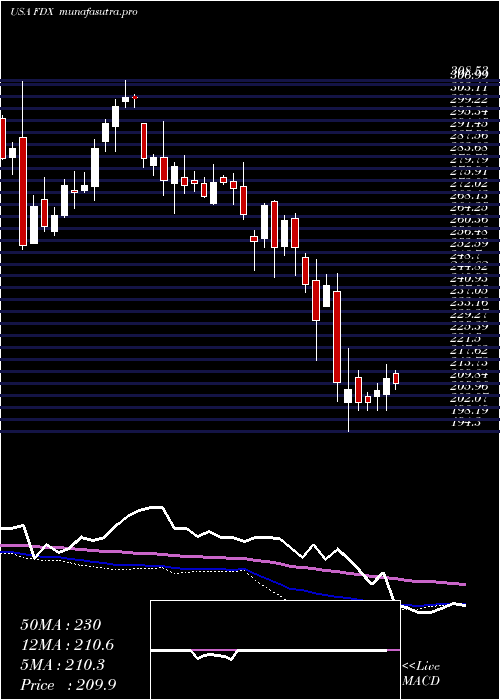
| DMA period | DMA value | | 5 day DMA | 236.82 | | 12 day DMA | 237.44 | | 20 day DMA | 237.26 | | 35 day DMA | 232.86 | | 50 day DMA | 232.18 | | 100 day DMA | 230.02 | | 150 day DMA | 227.16 | | 200 day DMA | 236.32 | EMA (exponential moving average) of Fedex Corporation FDX
| EMA period | EMA current | EMA prev | EMA prev2 | | 5 day EMA | 237.2 | 235.89 | 234.93 | | 12 day EMA | 236.5 | 235.9 | 235.55 | | 20 day EMA | 235.75 | 235.32 | 235.06 | | 35 day EMA | 234.3 | 233.98 | 233.75 | | 50 day EMA | 232.09 | 231.78 | 231.53 |
SMA (simple moving average) of Fedex Corporation FDX
| SMA period | SMA current | SMA prev | SMA prev2 | | 5 day SMA | 236.82 | 234.78 | 232.15 | | 12 day SMA | 237.44 | 237.65 | 237.79 | | 20 day SMA | 237.26 | 236.78 | 236.47 | | 35 day SMA | 232.86 | 232.61 | 232.42 | | 50 day SMA | 232.18 | 231.88 | 231.68 | | 100 day SMA | 230.02 | 229.82 | 229.61 | | 150 day SMA | 227.16 | 227.17 | 227.21 | | 200 day SMA | 236.32 | 236.53 | 236.75 |
|
|
