FidusInvestment FDUS full analysis,charts,indicators,moving averages,SMA,DMA,EMA,ADX,MACD,RSIFidus Investment FDUS WideScreen charts, DMA,SMA,EMA technical analysis, forecast prediction, by indicators ADX,MACD,RSI,CCI USA stock exchange
operates under N A sector & deals in N A
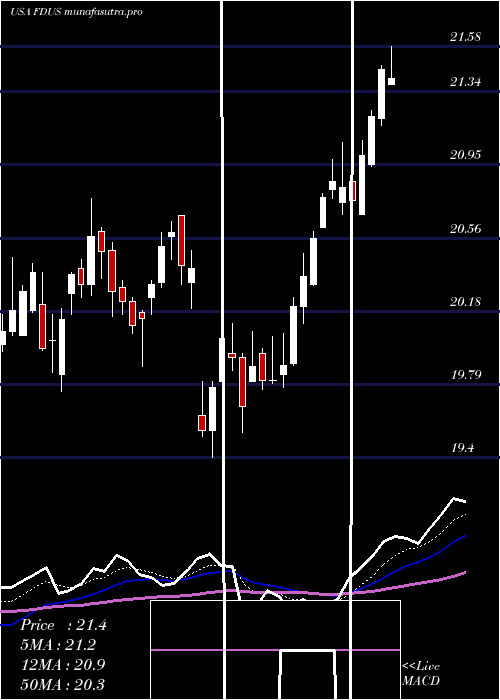
Daily price and charts and targets FidusInvestment Strong Daily Stock price targets for FidusInvestment FDUS are 19.95 and 20.35 | Daily Target 1 | 19.63 | | Daily Target 2 | 19.87 | | Daily Target 3 | 20.026666666667 | | Daily Target 4 | 20.27 | | Daily Target 5 | 20.43 |
Daily price and volume Fidus Investment
| Date |
Closing |
Open |
Range |
Volume |
Mon 20 October 2025 |
20.12 (0.85%) |
19.91 |
19.78 - 20.18 |
0.5948 times |
Fri 17 October 2025 |
19.95 (1.01%) |
19.80 |
19.72 - 20.04 |
0.8053 times |
Thu 16 October 2025 |
19.75 (-2.23%) |
20.23 |
19.69 - 20.23 |
0.6659 times |
Wed 15 October 2025 |
20.20 (0.5%) |
20.19 |
20.04 - 20.47 |
1.0322 times |
Tue 14 October 2025 |
20.10 (1.36%) |
19.68 |
19.68 - 20.16 |
0.6227 times |
Mon 13 October 2025 |
19.83 (2.69%) |
19.40 |
19.40 - 19.88 |
0.9176 times |
Fri 10 October 2025 |
19.31 (-1.08%) |
19.45 |
19.30 - 19.72 |
1.1802 times |
Thu 09 October 2025 |
19.52 (-1.96%) |
19.88 |
19.44 - 19.92 |
1.3329 times |
Wed 08 October 2025 |
19.91 (-0.35%) |
19.95 |
19.82 - 20.16 |
0.947 times |
Tue 07 October 2025 |
19.98 (-1.91%) |
20.37 |
19.79 - 20.48 |
1.9015 times |
Mon 06 October 2025 |
20.37 (-0.44%) |
20.54 |
20.32 - 20.63 |
1.0377 times |
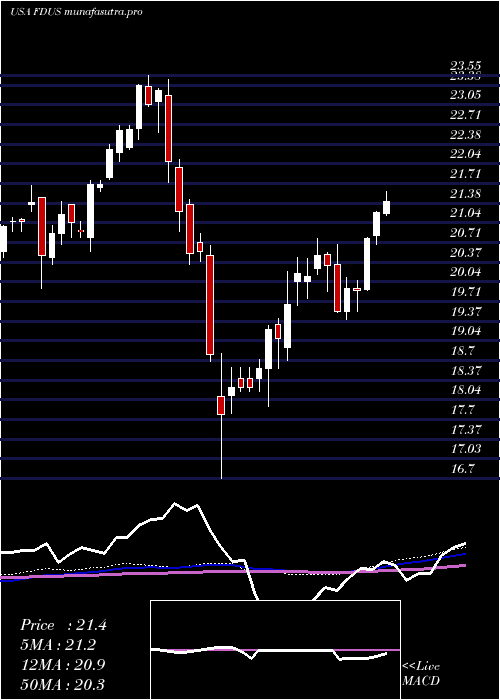
Weekly price and charts FidusInvestment Strong weekly Stock price targets for FidusInvestment FDUS are 19.95 and 20.35 | Weekly Target 1 | 19.63 | | Weekly Target 2 | 19.87 | | Weekly Target 3 | 20.026666666667 | | Weekly Target 4 | 20.27 | | Weekly Target 5 | 20.43 |
Weekly price and volumes for Fidus Investment
| Date |
Closing |
Open |
Range |
Volume |
Mon 20 October 2025 |
20.12 (0.85%) |
19.91 |
19.78 - 20.18 |
0.1556 times |
Fri 17 October 2025 |
19.95 (3.31%) |
19.40 |
19.40 - 20.47 |
1.058 times |
Fri 10 October 2025 |
19.31 (-5.62%) |
20.54 |
19.30 - 20.63 |
1.6744 times |
Fri 03 October 2025 |
20.46 (1.39%) |
20.29 |
20.05 - 20.63 |
1.0176 times |
Fri 26 September 2025 |
20.18 (-2.93%) |
20.79 |
20.18 - 20.79 |
1.5196 times |
Fri 19 September 2025 |
20.79 (-3.17%) |
21.50 |
20.43 - 21.50 |
1.7905 times |
Fri 12 September 2025 |
21.47 (0.37%) |
21.40 |
21.28 - 21.63 |
1.0828 times |
Fri 05 September 2025 |
21.39 (-0.65%) |
21.49 |
21.29 - 21.67 |
0.7543 times |
Fri 29 August 2025 |
21.53 (0%) |
21.40 |
21.40 - 21.60 |
0.1602 times |
Fri 29 August 2025 |
21.53 (0.94%) |
21.35 |
21.19 - 21.60 |
0.7869 times |
Fri 22 August 2025 |
21.33 (0.71%) |
21.19 |
21.03 - 21.45 |
0.8393 times |
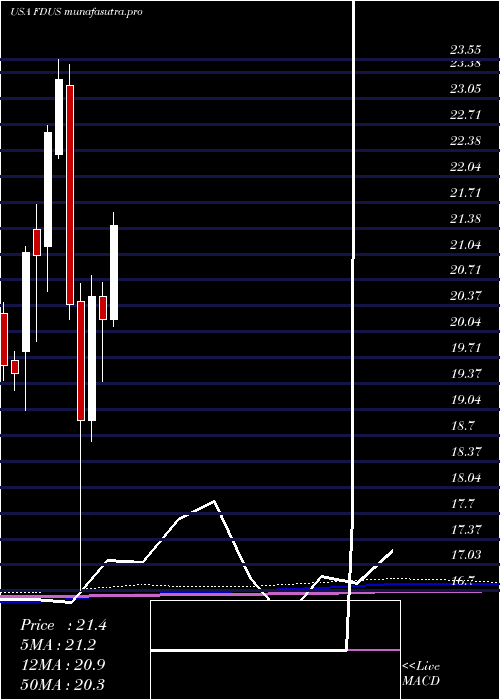
Monthly price and charts FidusInvestment Strong monthly Stock price targets for FidusInvestment FDUS are 19.05 and 20.38 | Monthly Target 1 | 18.69 | | Monthly Target 2 | 19.4 | | Monthly Target 3 | 20.016666666667 | | Monthly Target 4 | 20.73 | | Monthly Target 5 | 21.35 |
Monthly price and volumes Fidus Investment
| Date |
Closing |
Open |
Range |
Volume |
Mon 20 October 2025 |
20.12 (-0.69%) |
20.21 |
19.30 - 20.63 |
0.8341 times |
Tue 30 September 2025 |
20.26 (-5.9%) |
21.49 |
20.07 - 21.67 |
1.3539 times |
Fri 29 August 2025 |
21.53 (4.11%) |
20.50 |
20.30 - 21.60 |
0.9155 times |
Thu 31 July 2025 |
20.68 (2.38%) |
20.20 |
20.11 - 22.09 |
0.7194 times |
Mon 30 June 2025 |
20.20 (-1.42%) |
20.50 |
19.40 - 20.68 |
1.0092 times |
Fri 30 May 2025 |
20.49 (8.41%) |
18.90 |
18.62 - 20.77 |
0.8598 times |
Wed 30 April 2025 |
18.90 (-7.31%) |
20.43 |
16.70 - 20.66 |
1.2482 times |
Mon 31 March 2025 |
20.39 (-12.45%) |
23.21 |
20.20 - 23.48 |
1.4083 times |
Fri 28 February 2025 |
23.29 (3.01%) |
22.32 |
22.28 - 23.55 |
0.6914 times |
Fri 31 January 2025 |
22.61 (7.56%) |
21.14 |
20.56 - 22.70 |
0.9603 times |
Tue 31 December 2024 |
21.02 (-0.19%) |
21.36 |
19.92 - 21.68 |
0.9066 times |
DMA SMA EMA moving averages of Fidus Investment FDUS
DMA (daily moving average) of Fidus Investment FDUS
| DMA period | DMA value | | 5 day DMA | 20.02 | | 12 day DMA | 19.96 | | 20 day DMA | 20.11 | | 35 day DMA | 20.58 | | 50 day DMA | 20.81 | | 100 day DMA | 20.74 | | 150 day DMA | 20.3 | | 200 day DMA | 20.77 | EMA (exponential moving average) of Fidus Investment FDUS
| EMA period | EMA current | EMA prev | EMA prev2 | | 5 day EMA | 19.99 | 19.92 | 19.9 | | 12 day EMA | 20.02 | 20 | 20.01 | | 20 day EMA | 20.17 | 20.17 | 20.19 | | 35 day EMA | 20.42 | 20.44 | 20.47 | | 50 day EMA | 20.74 | 20.77 | 20.8 |
SMA (simple moving average) of Fidus Investment FDUS
| SMA period | SMA current | SMA prev | SMA prev2 | | 5 day SMA | 20.02 | 19.97 | 19.84 | | 12 day SMA | 19.96 | 19.99 | 20.03 | | 20 day SMA | 20.11 | 20.13 | 20.17 | | 35 day SMA | 20.58 | 20.62 | 20.66 | | 50 day SMA | 20.81 | 20.83 | 20.86 | | 100 day SMA | 20.74 | 20.74 | 20.75 | | 150 day SMA | 20.3 | 20.31 | 20.32 | | 200 day SMA | 20.77 | 20.77 | 20.78 |
|
|
