FreshDel FDP full analysis,charts,indicators,moving averages,SMA,DMA,EMA,ADX,MACD,RSIFresh Del FDP WideScreen charts, DMA,SMA,EMA technical analysis, forecast prediction, by indicators ADX,MACD,RSI,CCI USA stock exchange
operates under Consumer Non Durables sector & deals in Farming Seeds Milling
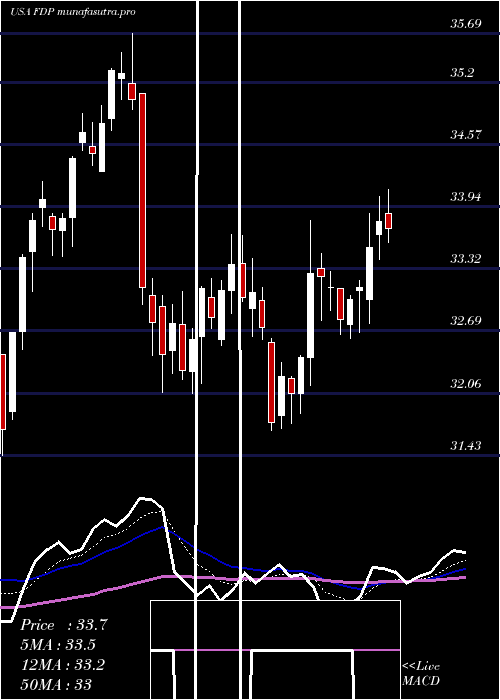
Daily price and charts and targets FreshDel Strong Daily Stock price targets for FreshDel FDP are 36.51 and 37.27 | Daily Target 1 | 36.37 | | Daily Target 2 | 36.65 | | Daily Target 3 | 37.126666666667 | | Daily Target 4 | 37.41 | | Daily Target 5 | 37.89 |
Daily price and volume Fresh Del
| Date |
Closing |
Open |
Range |
Volume |
Thu 04 December 2025 |
36.94 (-1.55%) |
37.54 |
36.84 - 37.60 |
0.7915 times |
Wed 03 December 2025 |
37.52 (1.9%) |
37.01 |
36.92 - 37.56 |
0.9065 times |
Tue 02 December 2025 |
36.82 (0.99%) |
36.60 |
36.30 - 36.87 |
0.8175 times |
Mon 01 December 2025 |
36.46 (0.89%) |
36.03 |
36.03 - 36.52 |
0.9671 times |
Fri 28 November 2025 |
36.14 (-0.08%) |
36.07 |
35.92 - 36.26 |
0.478 times |
Wed 26 November 2025 |
36.17 (1.86%) |
35.42 |
35.36 - 36.65 |
1.6176 times |
Tue 25 November 2025 |
35.51 (2.19%) |
34.95 |
34.89 - 35.67 |
0.9541 times |
Mon 24 November 2025 |
34.75 (-0.8%) |
34.85 |
34.58 - 35.18 |
1.1065 times |
Fri 21 November 2025 |
35.03 (1.48%) |
34.80 |
34.52 - 35.61 |
1.2286 times |
Thu 20 November 2025 |
34.52 (0.06%) |
34.59 |
34.07 - 34.78 |
1.1325 times |
Wed 19 November 2025 |
34.50 (-2.57%) |
35.28 |
34.41 - 35.42 |
0.9144 times |
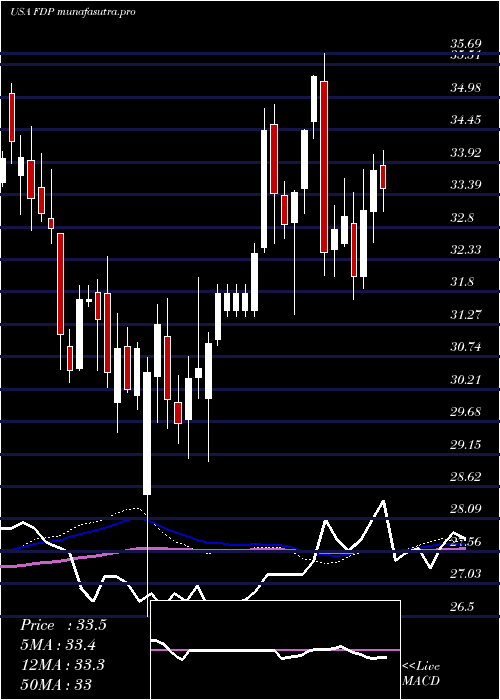
Weekly price and charts FreshDel Strong weekly Stock price targets for FreshDel FDP are 36.49 and 38.06 | Weekly Target 1 | 35.29 | | Weekly Target 2 | 36.11 | | Weekly Target 3 | 36.856666666667 | | Weekly Target 4 | 37.68 | | Weekly Target 5 | 38.43 |
Weekly price and volumes for Fresh Del
| Date |
Closing |
Open |
Range |
Volume |
Thu 04 December 2025 |
36.94 (2.21%) |
36.03 |
36.03 - 37.60 |
0.7888 times |
Fri 28 November 2025 |
36.14 (3.17%) |
34.85 |
34.58 - 36.65 |
0.9414 times |
Fri 21 November 2025 |
35.03 (-1.18%) |
35.56 |
34.07 - 35.74 |
1.1634 times |
Fri 14 November 2025 |
35.45 (-4.93%) |
37.31 |
35.29 - 38.11 |
0.9656 times |
Fri 07 November 2025 |
37.29 (5.49%) |
36.00 |
35.75 - 37.38 |
1.3492 times |
Fri 31 October 2025 |
35.35 (0%) |
34.60 |
34.40 - 35.35 |
0.4678 times |
Fri 31 October 2025 |
35.35 (2.85%) |
34.38 |
31.90 - 35.35 |
1.6945 times |
Fri 24 October 2025 |
34.37 (-0.38%) |
34.52 |
34.20 - 35.77 |
1.2629 times |
Fri 17 October 2025 |
34.50 (1.26%) |
33.36 |
32.92 - 34.50 |
0.9182 times |
Tue 07 October 2025 |
34.07 (-3.68%) |
35.50 |
33.70 - 35.50 |
0.4482 times |
Fri 03 October 2025 |
35.37 (0.97%) |
35.01 |
34.32 - 35.65 |
1.1926 times |
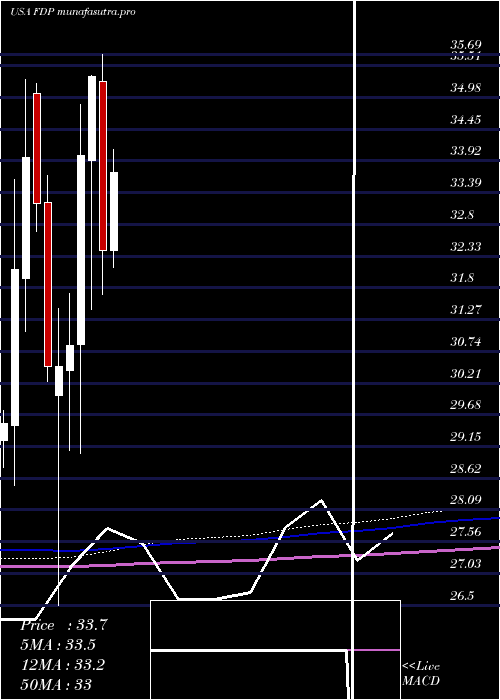
Monthly price and charts FreshDel Strong monthly Stock price targets for FreshDel FDP are 36.49 and 38.06 | Monthly Target 1 | 35.29 | | Monthly Target 2 | 36.11 | | Monthly Target 3 | 36.856666666667 | | Monthly Target 4 | 37.68 | | Monthly Target 5 | 38.43 |
Monthly price and volumes Fresh Del
| Date |
Closing |
Open |
Range |
Volume |
Thu 04 December 2025 |
36.94 (2.21%) |
36.03 |
36.03 - 37.60 |
0.1333 times |
Fri 28 November 2025 |
36.14 (2.23%) |
36.00 |
34.07 - 38.11 |
0.747 times |
Fri 31 October 2025 |
35.35 (1.81%) |
34.72 |
31.90 - 35.77 |
0.9129 times |
Tue 30 September 2025 |
34.72 (-4.3%) |
36.19 |
34.18 - 36.57 |
1.0665 times |
Fri 29 August 2025 |
36.28 (-3.48%) |
37.78 |
35.10 - 38.29 |
1.0399 times |
Thu 31 July 2025 |
37.59 (15.95%) |
32.42 |
32.14 - 40.75 |
1.1692 times |
Mon 30 June 2025 |
32.42 (-8.21%) |
35.24 |
31.68 - 35.69 |
1.1605 times |
Fri 30 May 2025 |
35.32 (3.85%) |
33.93 |
31.43 - 35.34 |
1.1676 times |
Wed 30 April 2025 |
34.01 (10.31%) |
30.85 |
29.03 - 34.86 |
1.1918 times |
Mon 31 March 2025 |
30.83 (1.12%) |
30.42 |
29.08 - 31.70 |
1.4113 times |
Fri 28 February 2025 |
30.49 (0%) |
30.00 |
26.50 - 31.45 |
1.056 times |
DMA SMA EMA moving averages of Fresh Del FDP
DMA (daily moving average) of Fresh Del FDP
| DMA period | DMA value | | 5 day DMA | 36.78 | | 12 day DMA | 35.81 | | 20 day DMA | 36.09 | | 35 day DMA | 35.54 | | 50 day DMA | 35.25 | | 100 day DMA | 35.51 | | 150 day DMA | 34.79 | | 200 day DMA | 33.8 | EMA (exponential moving average) of Fresh Del FDP
| EMA period | EMA current | EMA prev | EMA prev2 | | 5 day EMA | 36.76 | 36.67 | 36.24 | | 12 day EMA | 36.25 | 36.12 | 35.87 | | 20 day EMA | 36 | 35.9 | 35.73 | | 35 day EMA | 35.69 | 35.62 | 35.51 | | 50 day EMA | 35.45 | 35.39 | 35.3 |
SMA (simple moving average) of Fresh Del FDP
| SMA period | SMA current | SMA prev | SMA prev2 | | 5 day SMA | 36.78 | 36.62 | 36.22 | | 12 day SMA | 35.81 | 35.65 | 35.47 | | 20 day SMA | 36.09 | 36.06 | 35.99 | | 35 day SMA | 35.54 | 35.45 | 35.33 | | 50 day SMA | 35.25 | 35.23 | 35.2 | | 100 day SMA | 35.51 | 35.48 | 35.44 | | 150 day SMA | 34.79 | 34.77 | 34.75 | | 200 day SMA | 33.8 | 33.77 | 33.74 |
|
|
