FirstCommonwealth FCF full analysis,charts,indicators,moving averages,SMA,DMA,EMA,ADX,MACD,RSIFirst Commonwealth FCF WideScreen charts, DMA,SMA,EMA technical analysis, forecast prediction, by indicators ADX,MACD,RSI,CCI USA stock exchange
operates under Finance sector & deals in Major Banks
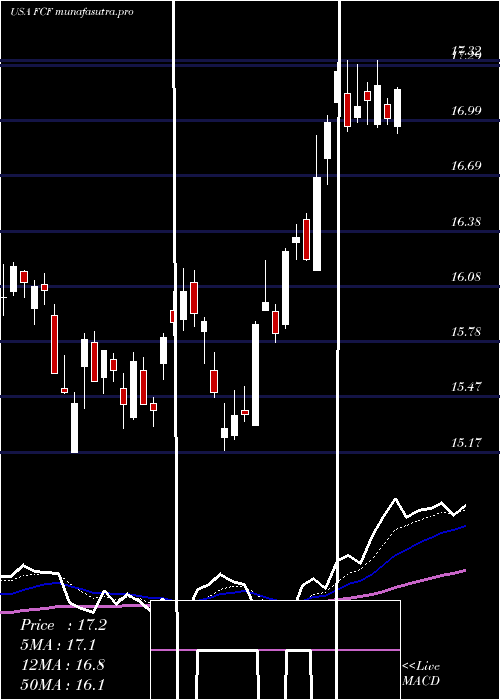
Daily price and charts and targets FirstCommonwealth Strong Daily Stock price targets for FirstCommonwealth FCF are 16.58 and 16.75 | Daily Target 1 | 16.45 | | Daily Target 2 | 16.53 | | Daily Target 3 | 16.623333333333 | | Daily Target 4 | 16.7 | | Daily Target 5 | 16.79 |
Daily price and volume First Commonwealth
| Date |
Closing |
Open |
Range |
Volume |
Thu 04 December 2025 |
16.60 (0.12%) |
16.55 |
16.55 - 16.72 |
0.8681 times |
Wed 03 December 2025 |
16.58 (0.48%) |
16.55 |
16.36 - 16.75 |
1.2495 times |
Tue 02 December 2025 |
16.50 (0.55%) |
16.72 |
16.48 - 16.92 |
0.9764 times |
Mon 01 December 2025 |
16.41 (0.98%) |
16.20 |
16.20 - 16.52 |
0.7648 times |
Fri 28 November 2025 |
16.25 (-0.67%) |
16.33 |
16.23 - 16.42 |
0.471 times |
Wed 26 November 2025 |
16.36 (-1.33%) |
16.47 |
16.35 - 16.66 |
1.4992 times |
Tue 25 November 2025 |
16.58 (2.92%) |
16.24 |
16.17 - 16.67 |
1.147 times |
Mon 24 November 2025 |
16.11 (0%) |
16.09 |
15.97 - 16.16 |
0.7695 times |
Fri 21 November 2025 |
16.11 (3.4%) |
15.64 |
15.64 - 16.26 |
1.0718 times |
Thu 20 November 2025 |
15.58 (0.19%) |
15.66 |
15.53 - 15.86 |
1.1827 times |
Wed 19 November 2025 |
15.55 (-0.32%) |
15.62 |
15.39 - 15.70 |
0.8934 times |
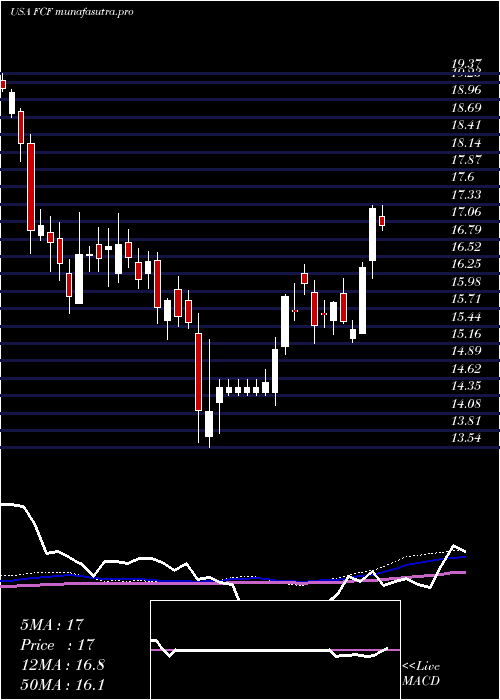
Weekly price and charts FirstCommonwealth Strong weekly Stock price targets for FirstCommonwealth FCF are 16.4 and 17.12 | Weekly Target 1 | 15.85 | | Weekly Target 2 | 16.23 | | Weekly Target 3 | 16.573333333333 | | Weekly Target 4 | 16.95 | | Weekly Target 5 | 17.29 |
Weekly price and volumes for First Commonwealth
| Date |
Closing |
Open |
Range |
Volume |
Thu 04 December 2025 |
16.60 (2.15%) |
16.20 |
16.20 - 16.92 |
0.8885 times |
Fri 28 November 2025 |
16.25 (0.87%) |
16.09 |
15.97 - 16.67 |
0.8949 times |
Fri 21 November 2025 |
16.11 (0.81%) |
15.95 |
15.30 - 16.26 |
1.2802 times |
Fri 14 November 2025 |
15.98 (1.46%) |
15.79 |
15.64 - 16.21 |
1.3003 times |
Fri 07 November 2025 |
15.75 (3.01%) |
15.41 |
15.39 - 15.92 |
1.1303 times |
Fri 31 October 2025 |
15.29 (0%) |
15.33 |
15.07 - 15.44 |
0.2369 times |
Fri 31 October 2025 |
15.29 (-7.16%) |
16.46 |
15.07 - 16.53 |
1.34 times |
Fri 24 October 2025 |
16.47 (3.52%) |
15.99 |
15.82 - 16.53 |
0.8402 times |
Fri 17 October 2025 |
15.91 (-1.12%) |
16.23 |
15.42 - 16.76 |
1.1492 times |
Fri 10 October 2025 |
16.09 (-4.28%) |
16.97 |
16.06 - 17.17 |
0.9394 times |
Fri 03 October 2025 |
16.81 (-3.39%) |
17.43 |
16.61 - 17.43 |
1.0626 times |
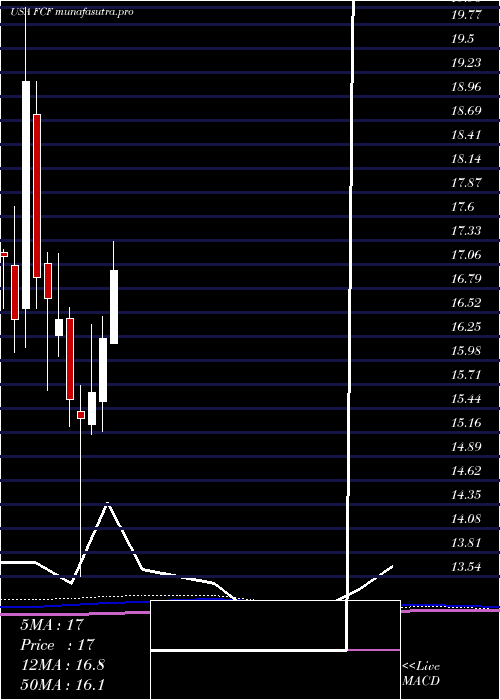
Monthly price and charts FirstCommonwealth Strong monthly Stock price targets for FirstCommonwealth FCF are 16.4 and 17.12 | Monthly Target 1 | 15.85 | | Monthly Target 2 | 16.23 | | Monthly Target 3 | 16.573333333333 | | Monthly Target 4 | 16.95 | | Monthly Target 5 | 17.29 |
Monthly price and volumes First Commonwealth
| Date |
Closing |
Open |
Range |
Volume |
Thu 04 December 2025 |
16.60 (2.15%) |
16.20 |
16.20 - 16.92 |
0.1829 times |
Fri 28 November 2025 |
16.25 (6.28%) |
15.41 |
15.30 - 16.67 |
0.9484 times |
Fri 31 October 2025 |
15.29 (-10.32%) |
16.86 |
15.07 - 17.17 |
1.0522 times |
Tue 30 September 2025 |
17.05 (-3.94%) |
17.48 |
16.87 - 18.28 |
1.0354 times |
Fri 29 August 2025 |
17.75 (7.51%) |
16.35 |
16.10 - 17.96 |
0.8775 times |
Thu 31 July 2025 |
16.51 (1.73%) |
16.17 |
16.07 - 17.32 |
1.1729 times |
Mon 30 June 2025 |
16.23 (3.91%) |
15.52 |
15.18 - 16.48 |
0.826 times |
Fri 30 May 2025 |
15.62 (1.96%) |
15.26 |
15.14 - 16.39 |
0.8314 times |
Wed 30 April 2025 |
15.32 (-1.42%) |
15.41 |
13.54 - 15.70 |
1.6245 times |
Mon 31 March 2025 |
15.54 (-5.47%) |
16.45 |
15.23 - 16.58 |
1.4487 times |
Fri 28 February 2025 |
16.44 (-1.44%) |
16.26 |
16.02 - 17.19 |
0.8335 times |
DMA SMA EMA moving averages of First Commonwealth FCF
DMA (daily moving average) of First Commonwealth FCF
| DMA period | DMA value | | 5 day DMA | 16.47 | | 12 day DMA | 16.19 | | 20 day DMA | 16.02 | | 35 day DMA | 15.97 | | 50 day DMA | 16.21 | | 100 day DMA | 16.65 | | 150 day DMA | 16.45 | | 200 day DMA | 16.15 | EMA (exponential moving average) of First Commonwealth FCF
| EMA period | EMA current | EMA prev | EMA prev2 | | 5 day EMA | 16.49 | 16.43 | 16.35 | | 12 day EMA | 16.28 | 16.22 | 16.16 | | 20 day EMA | 16.18 | 16.14 | 16.09 | | 35 day EMA | 16.24 | 16.22 | 16.2 | | 50 day EMA | 16.35 | 16.34 | 16.33 |
SMA (simple moving average) of First Commonwealth FCF
| SMA period | SMA current | SMA prev | SMA prev2 | | 5 day SMA | 16.47 | 16.42 | 16.42 | | 12 day SMA | 16.19 | 16.09 | 16.04 | | 20 day SMA | 16.02 | 15.99 | 15.94 | | 35 day SMA | 15.97 | 15.96 | 15.96 | | 50 day SMA | 16.21 | 16.23 | 16.24 | | 100 day SMA | 16.65 | 16.65 | 16.66 | | 150 day SMA | 16.45 | 16.44 | 16.43 | | 200 day SMA | 16.15 | 16.15 | 16.15 |
|
|
