FirstBancorp FBNC full analysis,charts,indicators,moving averages,SMA,DMA,EMA,ADX,MACD,RSIFirst Bancorp FBNC WideScreen charts, DMA,SMA,EMA technical analysis, forecast prediction, by indicators ADX,MACD,RSI,CCI USA stock exchange
operates under Finance sector & deals in Major Banks
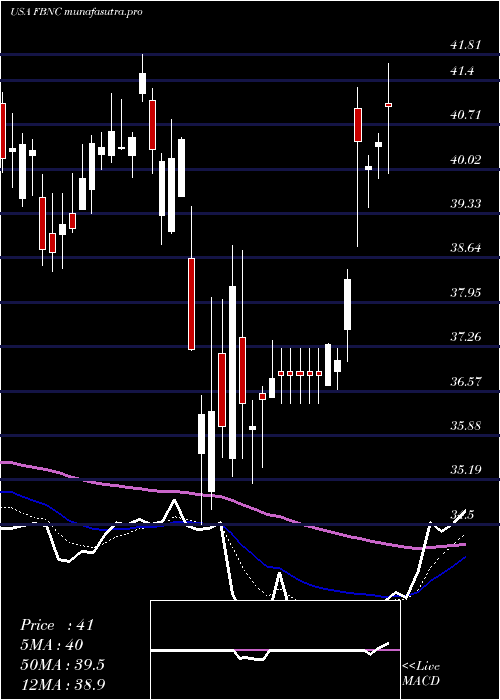
Daily price and charts and targets FirstBancorp Strong Daily Stock price targets for FirstBancorp FBNC are 51.41 and 52.28 | Daily Target 1 | 50.76 | | Daily Target 2 | 51.19 | | Daily Target 3 | 51.633333333333 | | Daily Target 4 | 52.06 | | Daily Target 5 | 52.5 |
Daily price and volume First Bancorp
| Date |
Closing |
Open |
Range |
Volume |
Thu 04 December 2025 |
51.61 (-0.19%) |
51.40 |
51.21 - 52.08 |
0.6587 times |
Wed 03 December 2025 |
51.71 (2.11%) |
50.82 |
50.82 - 51.92 |
0.8077 times |
Tue 02 December 2025 |
50.64 (-1.23%) |
51.56 |
50.61 - 51.56 |
0.7293 times |
Mon 01 December 2025 |
51.27 (0.51%) |
50.50 |
50.50 - 51.70 |
0.6265 times |
Fri 28 November 2025 |
51.01 (-0.74%) |
51.32 |
50.89 - 51.39 |
0.7366 times |
Wed 26 November 2025 |
51.39 (-0.33%) |
51.26 |
51.05 - 52.01 |
2.0348 times |
Tue 25 November 2025 |
51.56 (3.64%) |
50.08 |
49.55 - 52.09 |
1.6787 times |
Mon 24 November 2025 |
49.75 (-1.29%) |
50.26 |
49.70 - 50.30 |
0.8487 times |
Fri 21 November 2025 |
50.40 (2.84%) |
49.04 |
48.20 - 51.00 |
1.2473 times |
Thu 20 November 2025 |
49.01 (-0.43%) |
49.85 |
48.98 - 50.69 |
0.6317 times |
Wed 19 November 2025 |
49.22 (1.59%) |
48.28 |
48.16 - 49.43 |
0.9151 times |
Weekly price and charts FirstBancorp Strong weekly Stock price targets for FirstBancorp FBNC are 51.06 and 52.64 | Weekly Target 1 | 49.82 | | Weekly Target 2 | 50.71 | | Weekly Target 3 | 51.396666666667 | | Weekly Target 4 | 52.29 | | Weekly Target 5 | 52.98 |
Weekly price and volumes for First Bancorp
| Date |
Closing |
Open |
Range |
Volume |
Thu 04 December 2025 |
51.61 (1.18%) |
50.50 |
50.50 - 52.08 |
0.6096 times |
Fri 28 November 2025 |
51.01 (1.21%) |
50.26 |
49.55 - 52.09 |
1.1445 times |
Fri 21 November 2025 |
50.40 (-1.08%) |
50.67 |
47.83 - 51.00 |
1.0058 times |
Fri 14 November 2025 |
50.95 (-0.29%) |
51.30 |
49.29 - 51.76 |
0.9706 times |
Fri 07 November 2025 |
51.10 (5.27%) |
49.39 |
49.13 - 51.11 |
0.7938 times |
Fri 31 October 2025 |
48.54 (0%) |
48.68 |
48.12 - 48.80 |
0.1724 times |
Fri 31 October 2025 |
48.54 (-1.06%) |
49.24 |
48.12 - 49.97 |
1.1449 times |
Fri 24 October 2025 |
49.06 (2.92%) |
48.09 |
47.53 - 50.24 |
1.0074 times |
Fri 17 October 2025 |
47.67 (-3.09%) |
49.91 |
45.96 - 51.36 |
1.6824 times |
Fri 10 October 2025 |
49.19 (-5.96%) |
52.73 |
49.16 - 53.43 |
1.4686 times |
Fri 03 October 2025 |
52.31 (-1.65%) |
53.40 |
51.91 - 54.43 |
0.9401 times |
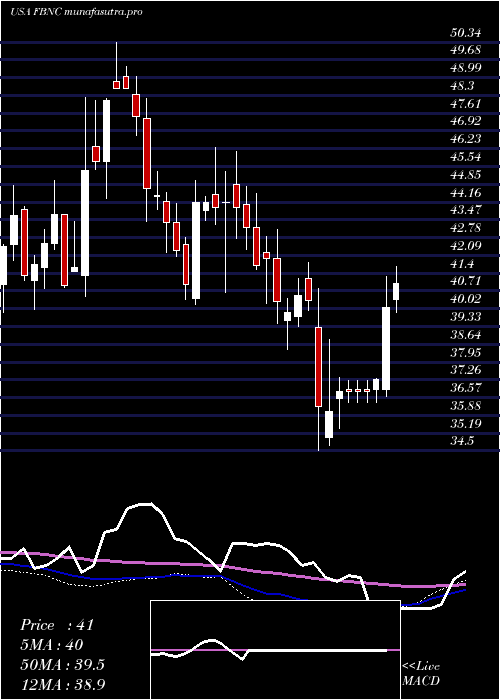
Monthly price and charts FirstBancorp Strong monthly Stock price targets for FirstBancorp FBNC are 51.06 and 52.64 | Monthly Target 1 | 49.82 | | Monthly Target 2 | 50.71 | | Monthly Target 3 | 51.396666666667 | | Monthly Target 4 | 52.29 | | Monthly Target 5 | 52.98 |
Monthly price and volumes First Bancorp
| Date |
Closing |
Open |
Range |
Volume |
Thu 04 December 2025 |
51.61 (1.18%) |
50.50 |
50.50 - 52.08 |
0.1303 times |
Fri 28 November 2025 |
51.01 (5.09%) |
49.39 |
47.83 - 52.09 |
0.8367 times |
Fri 31 October 2025 |
48.54 (-8.22%) |
52.59 |
45.96 - 53.43 |
1.2953 times |
Tue 30 September 2025 |
52.89 (-3.11%) |
54.25 |
52.23 - 56.45 |
1.02 times |
Fri 29 August 2025 |
54.59 (8.98%) |
49.80 |
45.04 - 55.49 |
1.2461 times |
Thu 31 July 2025 |
50.09 (13.61%) |
43.87 |
43.84 - 52.12 |
1.7294 times |
Mon 30 June 2025 |
44.09 (6.57%) |
41.19 |
40.00 - 44.67 |
1.0072 times |
Fri 30 May 2025 |
41.37 (2.25%) |
40.48 |
40.09 - 44.24 |
0.8154 times |
Wed 30 April 2025 |
40.46 (0.8%) |
39.05 |
34.50 - 41.66 |
1.0623 times |
Mon 31 March 2025 |
40.14 (-4.34%) |
41.96 |
38.43 - 43.10 |
0.8574 times |
Fri 28 February 2025 |
41.96 (-4.92%) |
44.83 |
40.24 - 46.14 |
0.7345 times |

DMA SMA EMA moving averages of First Bancorp FBNC
DMA (daily moving average) of First Bancorp FBNC
| DMA period | DMA value | | 5 day DMA | 51.25 | | 12 day DMA | 50.5 | | 20 day DMA | 50.47 | | 35 day DMA | 49.72 | | 50 day DMA | 50.27 | | 100 day DMA | 51.2 | | 150 day DMA | 48.38 | | 200 day DMA | 46.12 | EMA (exponential moving average) of First Bancorp FBNC
| EMA period | EMA current | EMA prev | EMA prev2 | | 5 day EMA | 51.29 | 51.13 | 50.84 | | 12 day EMA | 50.83 | 50.69 | 50.5 | | 20 day EMA | 50.56 | 50.45 | 50.32 | | 35 day EMA | 50.61 | 50.55 | 50.48 | | 50 day EMA | 50.64 | 50.6 | 50.55 |
SMA (simple moving average) of First Bancorp FBNC
| SMA period | SMA current | SMA prev | SMA prev2 | | 5 day SMA | 51.25 | 51.2 | 51.17 | | 12 day SMA | 50.5 | 50.22 | 50.15 | | 20 day SMA | 50.47 | 50.42 | 50.32 | | 35 day SMA | 49.72 | 49.66 | 49.64 | | 50 day SMA | 50.27 | 50.3 | 50.33 | | 100 day SMA | 51.2 | 51.14 | 51.1 | | 150 day SMA | 48.38 | 48.31 | 48.24 | | 200 day SMA | 46.12 | 46.08 | 46.03 |
|
|
