FirstBusiness FBIZ full analysis,charts,indicators,moving averages,SMA,DMA,EMA,ADX,MACD,RSIFirst Business FBIZ WideScreen charts, DMA,SMA,EMA technical analysis, forecast prediction, by indicators ADX,MACD,RSI,CCI USA stock exchange
operates under Finance sector & deals in Major Banks
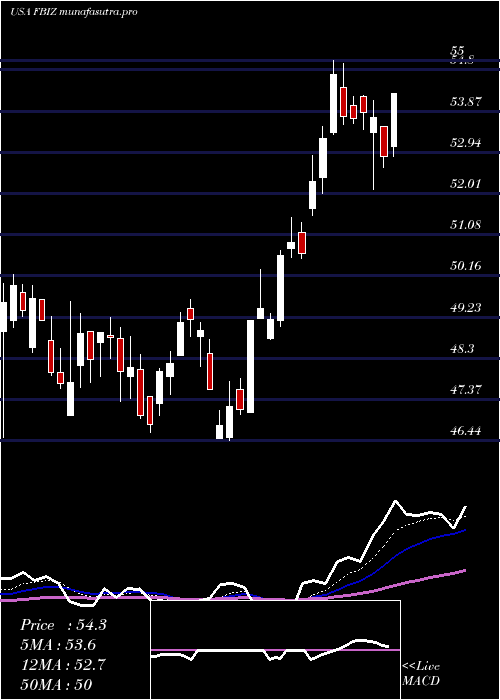
Daily price and charts and targets FirstBusiness Strong Daily Stock price targets for FirstBusiness FBIZ are 54.15 and 54.98 | Daily Target 1 | 53.53 | | Daily Target 2 | 53.94 | | Daily Target 3 | 54.36 | | Daily Target 4 | 54.77 | | Daily Target 5 | 55.19 |
Daily price and volume First Business
| Date |
Closing |
Open |
Range |
Volume |
Thu 04 December 2025 |
54.35 (-0.26%) |
54.25 |
53.95 - 54.78 |
1.0859 times |
Wed 03 December 2025 |
54.49 (3.49%) |
52.76 |
52.69 - 54.50 |
1.569 times |
Tue 02 December 2025 |
52.65 (-0.62%) |
53.53 |
52.65 - 53.81 |
1.0218 times |
Mon 01 December 2025 |
52.98 (1.46%) |
52.68 |
52.24 - 53.46 |
1.1116 times |
Fri 28 November 2025 |
52.22 (-0.59%) |
52.40 |
51.89 - 52.40 |
0.4062 times |
Wed 26 November 2025 |
52.53 (-0.13%) |
52.18 |
51.65 - 52.72 |
1.2356 times |
Tue 25 November 2025 |
52.60 (3.04%) |
51.10 |
50.70 - 52.98 |
1.1073 times |
Mon 24 November 2025 |
51.05 (-0.95%) |
51.15 |
50.62 - 51.44 |
0.7311 times |
Fri 21 November 2025 |
51.54 (3.35%) |
50.02 |
49.57 - 51.82 |
1.0902 times |
Thu 20 November 2025 |
49.87 (0.14%) |
50.48 |
49.54 - 50.48 |
0.6413 times |
Wed 19 November 2025 |
49.80 (-0.99%) |
50.13 |
49.36 - 50.13 |
0.7183 times |
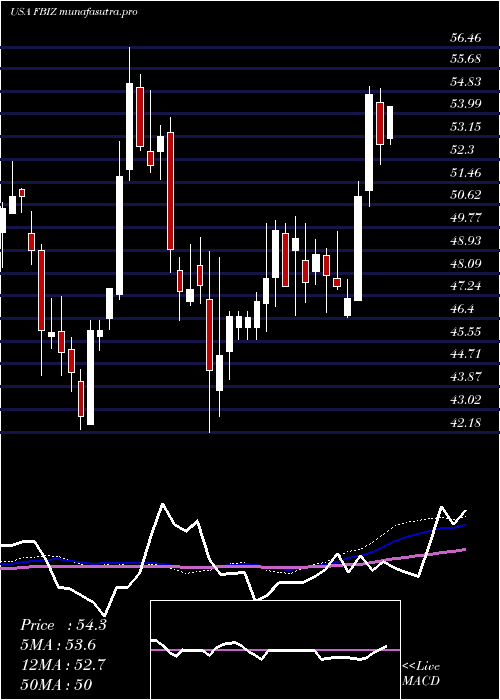
Weekly price and charts FirstBusiness Strong weekly Stock price targets for FirstBusiness FBIZ are 53.3 and 55.84 | Weekly Target 1 | 51.25 | | Weekly Target 2 | 52.8 | | Weekly Target 3 | 53.79 | | Weekly Target 4 | 55.34 | | Weekly Target 5 | 56.33 |
Weekly price and volumes for First Business
| Date |
Closing |
Open |
Range |
Volume |
Thu 04 December 2025 |
54.35 (4.08%) |
52.68 |
52.24 - 54.78 |
1.0265 times |
Fri 28 November 2025 |
52.22 (1.32%) |
51.15 |
50.62 - 52.98 |
0.746 times |
Fri 21 November 2025 |
51.54 (-1.4%) |
51.83 |
49.36 - 52.19 |
0.7653 times |
Fri 14 November 2025 |
52.27 (1.57%) |
51.56 |
50.80 - 53.17 |
0.8065 times |
Fri 07 November 2025 |
51.46 (1.68%) |
50.48 |
50.18 - 52.39 |
0.7369 times |
Fri 31 October 2025 |
50.61 (0%) |
49.72 |
47.87 - 51.21 |
0.5004 times |
Fri 31 October 2025 |
50.61 (0%) |
50.85 |
47.87 - 51.21 |
1.3876 times |
Fri 24 October 2025 |
50.61 (4.24%) |
48.76 |
48.74 - 50.75 |
1.0806 times |
Fri 17 October 2025 |
48.55 (-0.35%) |
49.43 |
46.07 - 50.91 |
1.8092 times |
Fri 10 October 2025 |
48.72 (-2.99%) |
50.60 |
48.72 - 51.94 |
1.1411 times |
Fri 03 October 2025 |
50.22 (-3.27%) |
51.89 |
49.23 - 51.89 |
2.4277 times |
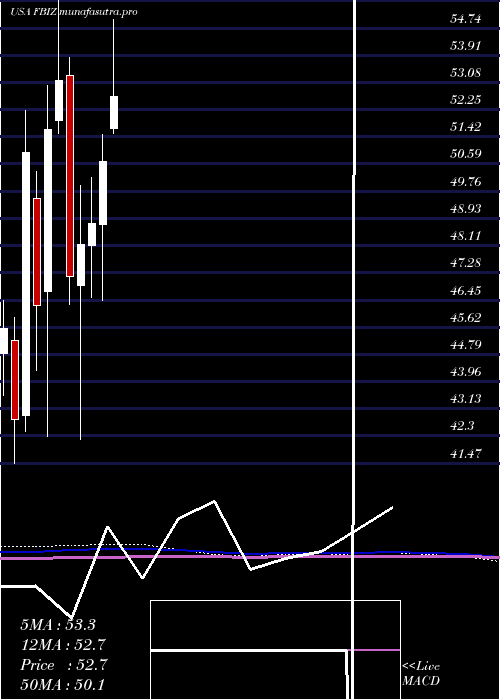
Monthly price and charts FirstBusiness Strong monthly Stock price targets for FirstBusiness FBIZ are 53.3 and 55.84 | Monthly Target 1 | 51.25 | | Monthly Target 2 | 52.8 | | Monthly Target 3 | 53.79 | | Monthly Target 4 | 55.34 | | Monthly Target 5 | 56.33 |
Monthly price and volumes First Business
| Date |
Closing |
Open |
Range |
Volume |
Thu 04 December 2025 |
54.35 (4.08%) |
52.68 |
52.24 - 54.78 |
0.1697 times |
Fri 28 November 2025 |
52.22 (3.18%) |
50.48 |
49.36 - 53.17 |
0.5049 times |
Fri 31 October 2025 |
50.61 (-1.27%) |
50.96 |
46.07 - 51.94 |
1.1332 times |
Tue 30 September 2025 |
51.26 (-2.03%) |
51.79 |
50.50 - 53.47 |
1.1456 times |
Fri 29 August 2025 |
52.32 (9.87%) |
47.62 |
45.90 - 52.88 |
1.0756 times |
Thu 31 July 2025 |
47.62 (-6%) |
51.67 |
46.51 - 55.00 |
1.6277 times |
Mon 30 June 2025 |
50.66 (3.88%) |
48.74 |
46.44 - 51.48 |
1.6106 times |
Fri 30 May 2025 |
48.77 (1.31%) |
48.11 |
46.51 - 50.19 |
1.0865 times |
Wed 30 April 2025 |
48.14 (2.1%) |
46.90 |
42.18 - 49.93 |
0.7474 times |
Mon 31 March 2025 |
47.15 (-11.27%) |
53.29 |
46.31 - 53.84 |
0.8988 times |
Fri 28 February 2025 |
53.14 (2.86%) |
51.91 |
51.51 - 56.46 |
1.0199 times |
DMA SMA EMA moving averages of First Business FBIZ
DMA (daily moving average) of First Business FBIZ
| DMA period | DMA value | | 5 day DMA | 53.34 | | 12 day DMA | 52.03 | | 20 day DMA | 51.98 | | 35 day DMA | 51.1 | | 50 day DMA | 50.88 | | 100 day DMA | 50.83 | | 150 day DMA | 50.42 | | 200 day DMA | 49.9 | EMA (exponential moving average) of First Business FBIZ
| EMA period | EMA current | EMA prev | EMA prev2 | | 5 day EMA | 53.52 | 53.1 | 52.41 | | 12 day EMA | 52.62 | 52.31 | 51.91 | | 20 day EMA | 52.12 | 51.88 | 51.6 | | 35 day EMA | 51.63 | 51.47 | 51.29 | | 50 day EMA | 51.23 | 51.1 | 50.96 |
SMA (simple moving average) of First Business FBIZ
| SMA period | SMA current | SMA prev | SMA prev2 | | 5 day SMA | 53.34 | 52.97 | 52.6 | | 12 day SMA | 52.03 | 51.7 | 51.51 | | 20 day SMA | 51.98 | 51.86 | 51.66 | | 35 day SMA | 51.1 | 50.97 | 50.86 | | 50 day SMA | 50.88 | 50.83 | 50.77 | | 100 day SMA | 50.83 | 50.82 | 50.82 | | 150 day SMA | 50.42 | 50.37 | 50.33 | | 200 day SMA | 49.9 | 49.89 | 49.89 |
|
|
