FortressBiotech FBIOP full analysis,charts,indicators,moving averages,SMA,DMA,EMA,ADX,MACD,RSIFortress Biotech FBIOP WideScreen charts, DMA,SMA,EMA technical analysis, forecast prediction, by indicators ADX,MACD,RSI,CCI USA stock exchange
operates under Health Care sector & deals in Major Pharmaceuticals
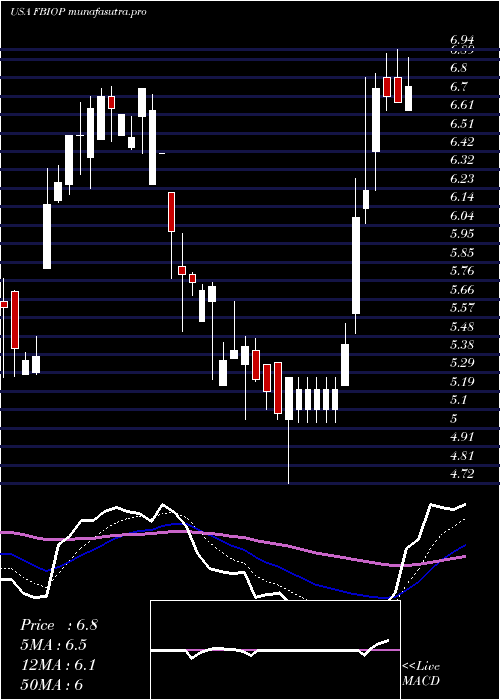
Daily price and charts and targets FortressBiotech Strong Daily Stock price targets for FortressBiotech FBIOP are 7.02 and 7.28 | Daily Target 1 | 6.8 | | Daily Target 2 | 6.98 | | Daily Target 3 | 7.0633333333333 | | Daily Target 4 | 7.24 | | Daily Target 5 | 7.32 |
Daily price and volume Fortress Biotech
| Date |
Closing |
Open |
Range |
Volume |
Thu 04 December 2025 |
7.15 (2.88%) |
6.95 |
6.89 - 7.15 |
0.9845 times |
Wed 03 December 2025 |
6.95 (-1.42%) |
6.73 |
6.69 - 6.99 |
0.9071 times |
Tue 02 December 2025 |
7.05 (-0.28%) |
7.19 |
6.75 - 7.19 |
0.9403 times |
Mon 01 December 2025 |
7.07 (2.46%) |
6.73 |
6.73 - 7.15 |
1.3274 times |
Fri 28 November 2025 |
6.90 (0.29%) |
6.89 |
6.89 - 6.92 |
0.2765 times |
Wed 26 November 2025 |
6.88 (0.44%) |
6.87 |
6.81 - 6.96 |
1.2832 times |
Tue 25 November 2025 |
6.85 (2.24%) |
6.58 |
6.58 - 6.87 |
1.0066 times |
Mon 24 November 2025 |
6.70 (2.6%) |
6.50 |
6.50 - 6.75 |
1.0398 times |
Fri 21 November 2025 |
6.53 (-0.46%) |
6.52 |
6.50 - 6.67 |
0.7522 times |
Thu 20 November 2025 |
6.56 (-2.96%) |
6.75 |
6.50 - 6.76 |
1.4823 times |
Wed 19 November 2025 |
6.76 (-2.03%) |
6.96 |
6.71 - 6.98 |
0.7522 times |
Weekly price and charts FortressBiotech Strong weekly Stock price targets for FortressBiotech FBIOP are 6.92 and 7.42 | Weekly Target 1 | 6.51 | | Weekly Target 2 | 6.83 | | Weekly Target 3 | 7.01 | | Weekly Target 4 | 7.33 | | Weekly Target 5 | 7.51 |
Weekly price and volumes for Fortress Biotech
| Date |
Closing |
Open |
Range |
Volume |
Thu 04 December 2025 |
7.15 (3.62%) |
6.73 |
6.69 - 7.19 |
0.8851 times |
Fri 28 November 2025 |
6.90 (5.67%) |
6.50 |
6.50 - 6.96 |
0.7674 times |
Fri 21 November 2025 |
6.53 (-6.71%) |
6.70 |
6.50 - 7.00 |
1.2241 times |
Fri 14 November 2025 |
7.00 (3.24%) |
6.73 |
6.27 - 7.09 |
1.3748 times |
Fri 07 November 2025 |
6.78 (-3.14%) |
6.82 |
6.66 - 7.00 |
0.5885 times |
Fri 31 October 2025 |
7.00 (0%) |
6.93 |
6.90 - 7.00 |
0.0541 times |
Fri 31 October 2025 |
7.00 (1.01%) |
6.95 |
6.75 - 7.30 |
1.2971 times |
Fri 24 October 2025 |
6.93 (1.76%) |
6.84 |
6.72 - 7.10 |
0.7039 times |
Fri 17 October 2025 |
6.81 (-4.62%) |
7.20 |
6.62 - 7.28 |
1.5419 times |
Fri 10 October 2025 |
7.14 (-3.25%) |
7.10 |
7.05 - 7.51 |
1.5631 times |
Fri 03 October 2025 |
7.38 (-19.7%) |
9.34 |
7.00 - 9.45 |
6.0597 times |
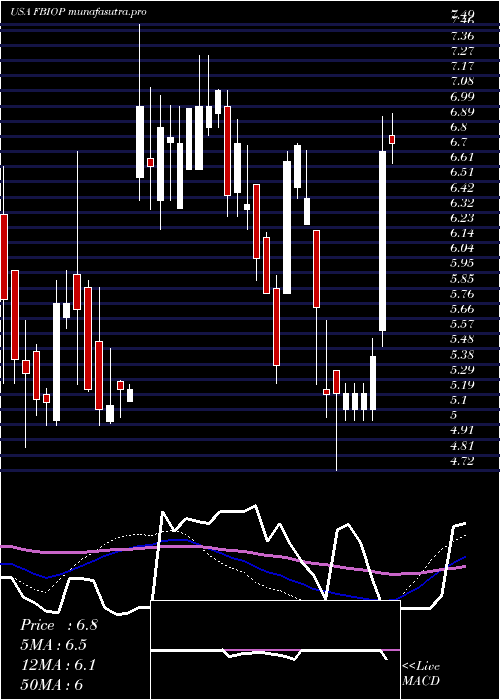
Monthly price and charts FortressBiotech Strong monthly Stock price targets for FortressBiotech FBIOP are 6.92 and 7.42 | Monthly Target 1 | 6.51 | | Monthly Target 2 | 6.83 | | Monthly Target 3 | 7.01 | | Monthly Target 4 | 7.33 | | Monthly Target 5 | 7.51 |
Monthly price and volumes Fortress Biotech
| Date |
Closing |
Open |
Range |
Volume |
Thu 04 December 2025 |
7.15 (3.62%) |
6.73 |
6.69 - 7.19 |
0.1276 times |
Fri 28 November 2025 |
6.90 (-1.43%) |
6.82 |
6.27 - 7.09 |
0.57 times |
Fri 31 October 2025 |
7.00 (-23.91%) |
7.00 |
6.62 - 7.80 |
1.2484 times |
Tue 30 September 2025 |
9.20 (12.33%) |
8.41 |
8.29 - 9.85 |
2.2934 times |
Fri 29 August 2025 |
8.19 (19.21%) |
7.30 |
6.75 - 8.44 |
1.1258 times |
Thu 31 July 2025 |
6.87 (-10.78%) |
7.38 |
6.51 - 8.66 |
1.2541 times |
Mon 30 June 2025 |
7.70 (-2.53%) |
7.96 |
7.10 - 9.49 |
0.5232 times |
Fri 30 May 2025 |
7.90 (17.91%) |
6.70 |
5.60 - 7.96 |
0.8466 times |
Wed 30 April 2025 |
6.70 (11.48%) |
5.83 |
4.72 - 6.94 |
0.7468 times |
Mon 31 March 2025 |
6.01 (3.26%) |
5.85 |
5.26 - 6.75 |
1.264 times |
Fri 28 February 2025 |
5.82 (-9.49%) |
6.45 |
5.82 - 6.90 |
0.4435 times |

DMA SMA EMA moving averages of Fortress Biotech FBIOP
DMA (daily moving average) of Fortress Biotech FBIOP
| DMA period | DMA value | | 5 day DMA | 7.02 | | 12 day DMA | 6.86 | | 20 day DMA | 6.81 | | 35 day DMA | 6.84 | | 50 day DMA | 7.11 | | 100 day DMA | 7.54 | | 150 day DMA | 7.56 | | 200 day DMA | 7.16 | EMA (exponential moving average) of Fortress Biotech FBIOP
| EMA period | EMA current | EMA prev | EMA prev2 | | 5 day EMA | 7.02 | 6.95 | 6.95 | | 12 day EMA | 6.91 | 6.87 | 6.86 | | 20 day EMA | 6.92 | 6.9 | 6.89 | | 35 day EMA | 7.07 | 7.07 | 7.08 | | 50 day EMA | 7.27 | 7.27 | 7.28 |
SMA (simple moving average) of Fortress Biotech FBIOP
| SMA period | SMA current | SMA prev | SMA prev2 | | 5 day SMA | 7.02 | 6.97 | 6.95 | | 12 day SMA | 6.86 | 6.82 | 6.82 | | 20 day SMA | 6.81 | 6.8 | 6.79 | | 35 day SMA | 6.84 | 6.82 | 6.82 | | 50 day SMA | 7.11 | 7.15 | 7.19 | | 100 day SMA | 7.54 | 7.55 | 7.57 | | 150 day SMA | 7.56 | 7.56 | 7.56 | | 200 day SMA | 7.16 | 7.16 | 7.15 |
|
|
