FateTherapeutics FATE full analysis,charts,indicators,moving averages,SMA,DMA,EMA,ADX,MACD,RSIFate Therapeutics FATE WideScreen charts, DMA,SMA,EMA technical analysis, forecast prediction, by indicators ADX,MACD,RSI,CCI USA stock exchange
operates under Health Care sector & deals in Biotechnology Biological Products No Diagnostic Substances
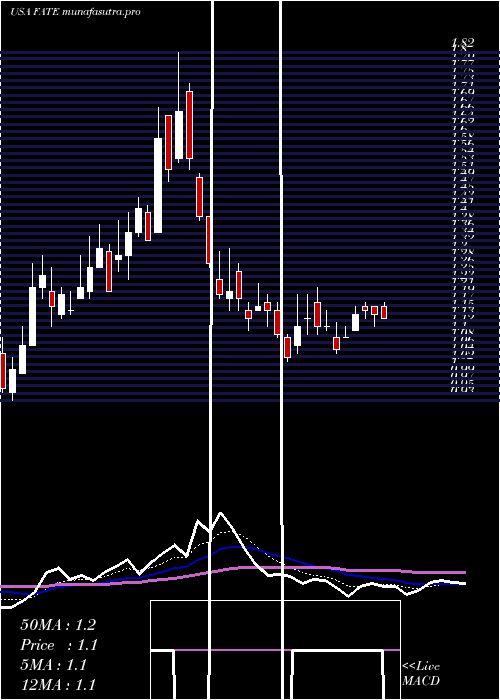
Daily price and charts and targets FateTherapeutics Strong Daily Stock price targets for FateTherapeutics FATE are 1.51 and 1.6 | Daily Target 1 | 1.43 | | Daily Target 2 | 1.49 | | Daily Target 3 | 1.5233333333333 | | Daily Target 4 | 1.58 | | Daily Target 5 | 1.61 |
Daily price and volume Fate Therapeutics
| Date |
Closing |
Open |
Range |
Volume |
Mon 20 October 2025 |
1.54 (4.76%) |
1.50 |
1.47 - 1.56 |
0.3963 times |
Fri 17 October 2025 |
1.47 (-4.55%) |
1.52 |
1.45 - 1.53 |
0.5599 times |
Thu 16 October 2025 |
1.54 (0.65%) |
1.52 |
1.48 - 1.65 |
0.7125 times |
Wed 15 October 2025 |
1.53 (2%) |
1.51 |
1.44 - 1.53 |
0.6786 times |
Tue 14 October 2025 |
1.50 (7.91%) |
1.38 |
1.30 - 1.50 |
0.9758 times |
Mon 13 October 2025 |
1.39 (-15.24%) |
1.61 |
1.38 - 1.63 |
0.8694 times |
Fri 10 October 2025 |
1.64 (1.86%) |
1.63 |
1.44 - 1.66 |
1.6093 times |
Thu 09 October 2025 |
1.61 (6.62%) |
1.52 |
1.43 - 1.66 |
2.2677 times |
Wed 08 October 2025 |
1.51 (8.63%) |
1.38 |
1.36 - 1.51 |
0.9656 times |
Tue 07 October 2025 |
1.39 (-1.42%) |
1.40 |
1.27 - 1.41 |
0.9649 times |
Mon 06 October 2025 |
1.41 (14.63%) |
1.23 |
1.19 - 1.46 |
2.2825 times |
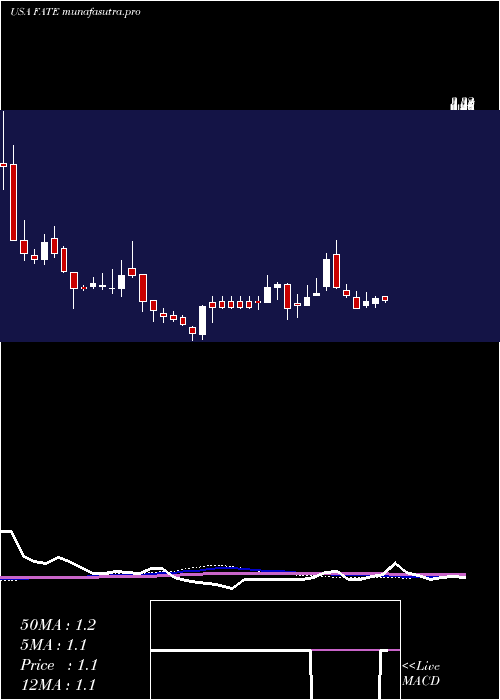
Weekly price and charts FateTherapeutics Strong weekly Stock price targets for FateTherapeutics FATE are 1.51 and 1.6 | Weekly Target 1 | 1.43 | | Weekly Target 2 | 1.49 | | Weekly Target 3 | 1.5233333333333 | | Weekly Target 4 | 1.58 | | Weekly Target 5 | 1.61 |
Weekly price and volumes for Fate Therapeutics
| Date |
Closing |
Open |
Range |
Volume |
Mon 20 October 2025 |
1.54 (4.76%) |
1.50 |
1.47 - 1.56 |
0.1186 times |
Fri 17 October 2025 |
1.47 (-10.37%) |
1.61 |
1.30 - 1.65 |
1.136 times |
Fri 10 October 2025 |
1.64 (33.33%) |
1.23 |
1.19 - 1.66 |
2.4209 times |
Fri 03 October 2025 |
1.23 (23%) |
1.02 |
1.00 - 1.37 |
2.5624 times |
Fri 26 September 2025 |
1.00 (4.17%) |
0.95 |
0.94 - 1.03 |
0.7779 times |
Fri 19 September 2025 |
0.96 (0%) |
0.97 |
0.94 - 1.02 |
0.7261 times |
Fri 12 September 2025 |
0.96 (-4.95%) |
1.02 |
0.93 - 1.08 |
0.8245 times |
Fri 05 September 2025 |
1.01 (-2.88%) |
1.04 |
0.95 - 1.08 |
0.6542 times |
Fri 29 August 2025 |
1.04 (0%) |
1.08 |
1.03 - 1.10 |
0.0995 times |
Fri 29 August 2025 |
1.04 (-9.57%) |
1.17 |
1.03 - 1.17 |
0.68 times |
Fri 22 August 2025 |
1.15 (5.5%) |
1.10 |
1.06 - 1.22 |
0.8257 times |
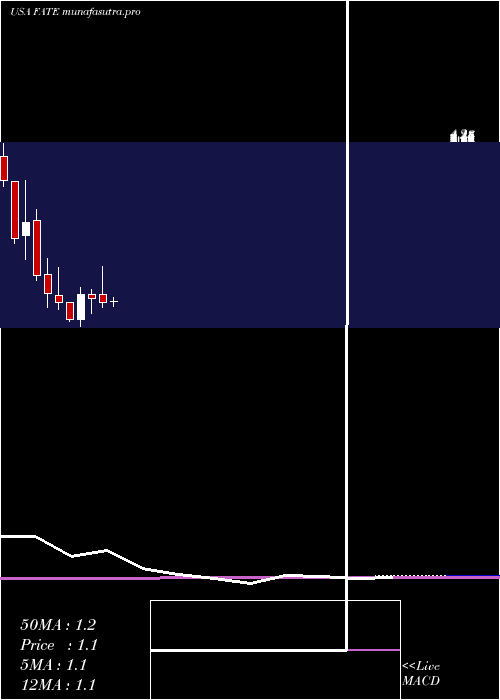
Monthly price and charts FateTherapeutics Strong monthly Stock price targets for FateTherapeutics FATE are 1.34 and 1.87 | Monthly Target 1 | 0.91 | | Monthly Target 2 | 1.23 | | Monthly Target 3 | 1.4433333333333 | | Monthly Target 4 | 1.76 | | Monthly Target 5 | 1.97 |
Monthly price and volumes Fate Therapeutics
| Date |
Closing |
Open |
Range |
Volume |
Mon 20 October 2025 |
1.54 (22.22%) |
1.25 |
1.13 - 1.66 |
1.0949 times |
Tue 30 September 2025 |
1.26 (21.15%) |
1.04 |
0.93 - 1.27 |
0.9433 times |
Fri 29 August 2025 |
1.04 (-5.45%) |
1.10 |
0.91 - 1.24 |
0.7521 times |
Thu 31 July 2025 |
1.10 (-1.79%) |
1.14 |
1.05 - 1.35 |
0.7798 times |
Mon 30 June 2025 |
1.12 (-7.44%) |
1.29 |
1.03 - 1.82 |
1.0462 times |
Fri 30 May 2025 |
1.21 (-5.47%) |
1.28 |
0.91 - 1.38 |
0.9063 times |
Wed 30 April 2025 |
1.28 (62.03%) |
0.79 |
0.66 - 1.42 |
1.1357 times |
Mon 31 March 2025 |
0.79 (-29.46%) |
1.13 |
0.76 - 1.13 |
0.8614 times |
Fri 28 February 2025 |
1.12 (-13.85%) |
1.27 |
1.00 - 1.81 |
1.3175 times |
Fri 31 January 2025 |
1.30 (-21.21%) |
1.68 |
1.04 - 1.99 |
1.1628 times |
Tue 31 December 2024 |
1.65 (-38.43%) |
2.71 |
1.55 - 2.93 |
1.3531 times |
DMA SMA EMA moving averages of Fate Therapeutics FATE
DMA (daily moving average) of Fate Therapeutics FATE
| DMA period | DMA value | | 5 day DMA | 1.52 | | 12 day DMA | 1.48 | | 20 day DMA | 1.32 | | 35 day DMA | 1.18 | | 50 day DMA | 1.15 | | 100 day DMA | 1.18 | | 150 day DMA | 1.13 | | 200 day DMA | 1.17 | EMA (exponential moving average) of Fate Therapeutics FATE
| EMA period | EMA current | EMA prev | EMA prev2 | | 5 day EMA | 1.51 | 1.5 | 1.51 | | 12 day EMA | 1.45 | 1.43 | 1.42 | | 20 day EMA | 1.35 | 1.33 | 1.32 | | 35 day EMA | 1.29 | 1.27 | 1.26 | | 50 day EMA | 1.18 | 1.17 | 1.16 |
SMA (simple moving average) of Fate Therapeutics FATE
| SMA period | SMA current | SMA prev | SMA prev2 | | 5 day SMA | 1.52 | 1.49 | 1.52 | | 12 day SMA | 1.48 | 1.45 | 1.43 | | 20 day SMA | 1.32 | 1.29 | 1.27 | | 35 day SMA | 1.18 | 1.16 | 1.15 | | 50 day SMA | 1.15 | 1.14 | 1.13 | | 100 day SMA | 1.18 | 1.17 | 1.17 | | 150 day SMA | 1.13 | 1.13 | 1.13 | | 200 day SMA | 1.17 | 1.17 | 1.17 |
|
|
