FarmerBrothers FARM full analysis,charts,indicators,moving averages,SMA,DMA,EMA,ADX,MACD,RSIFarmer Brothers FARM WideScreen charts, DMA,SMA,EMA technical analysis, forecast prediction, by indicators ADX,MACD,RSI,CCI USA stock exchange
operates under Consumer Non Durables sector & deals in Packaged Foods
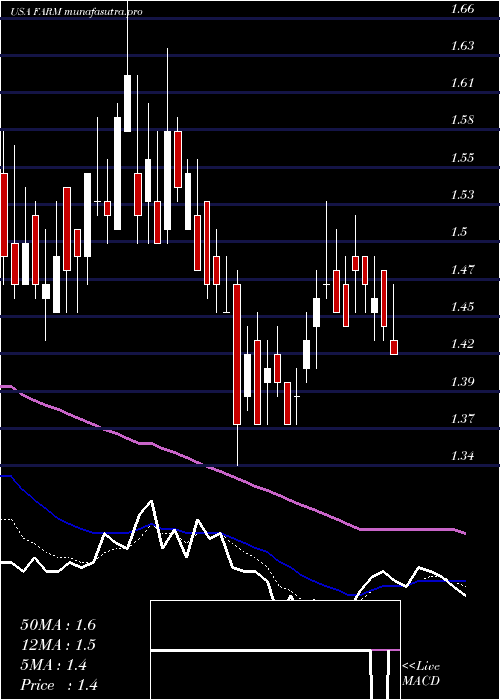
Daily price and charts and targets FarmerBrothers Strong Daily Stock price targets for FarmerBrothers FARM are 1.52 and 1.58 | Daily Target 1 | 1.47 | | Daily Target 2 | 1.5 | | Daily Target 3 | 1.5266666666667 | | Daily Target 4 | 1.56 | | Daily Target 5 | 1.59 |
Daily price and volume Farmer Brothers
| Date |
Closing |
Open |
Range |
Volume |
Thu 04 December 2025 |
1.54 (0%) |
1.52 |
1.49 - 1.55 |
0.9994 times |
Wed 03 December 2025 |
1.54 (-0.65%) |
1.53 |
1.52 - 1.55 |
0.7324 times |
Tue 02 December 2025 |
1.55 (0.65%) |
1.54 |
1.50 - 1.56 |
1.07 times |
Mon 01 December 2025 |
1.54 (-4.35%) |
1.59 |
1.54 - 1.62 |
0.6618 times |
Fri 28 November 2025 |
1.61 (3.21%) |
1.56 |
1.54 - 1.61 |
0.4368 times |
Wed 26 November 2025 |
1.56 (0.65%) |
1.52 |
1.51 - 1.62 |
2.1572 times |
Tue 25 November 2025 |
1.55 (1.97%) |
1.52 |
1.52 - 1.55 |
0.7667 times |
Mon 24 November 2025 |
1.52 (-1.3%) |
1.54 |
1.50 - 1.55 |
0.2155 times |
Fri 21 November 2025 |
1.54 (4.05%) |
1.51 |
1.47 - 1.55 |
0.6714 times |
Thu 20 November 2025 |
1.48 (-3.9%) |
1.56 |
1.47 - 1.56 |
2.2888 times |
Wed 19 November 2025 |
1.54 (-0.65%) |
1.55 |
1.49 - 1.57 |
1.7852 times |
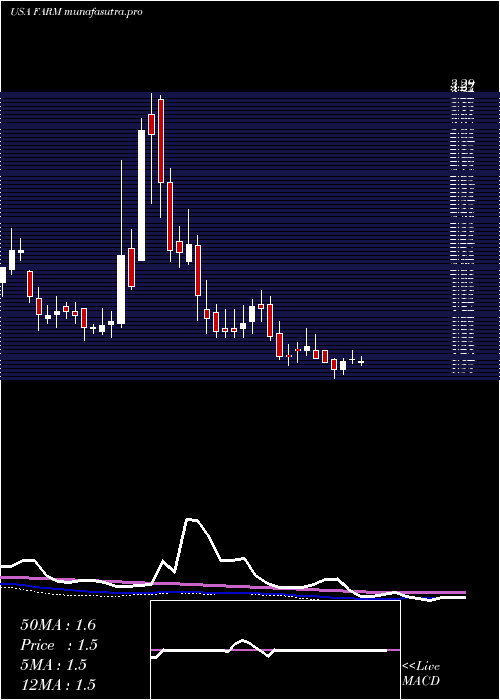
Weekly price and charts FarmerBrothers Strong weekly Stock price targets for FarmerBrothers FARM are 1.45 and 1.58 | Weekly Target 1 | 1.42 | | Weekly Target 2 | 1.48 | | Weekly Target 3 | 1.55 | | Weekly Target 4 | 1.61 | | Weekly Target 5 | 1.68 |
Weekly price and volumes for Farmer Brothers
| Date |
Closing |
Open |
Range |
Volume |
Thu 04 December 2025 |
1.54 (-4.35%) |
1.59 |
1.49 - 1.62 |
0.6048 times |
Fri 28 November 2025 |
1.61 (4.55%) |
1.54 |
1.50 - 1.62 |
0.6244 times |
Fri 21 November 2025 |
1.54 (6.21%) |
1.48 |
1.47 - 1.58 |
1.3191 times |
Fri 14 November 2025 |
1.45 (0%) |
1.45 |
1.43 - 1.55 |
1.2084 times |
Fri 07 November 2025 |
1.45 (-17.61%) |
1.78 |
1.40 - 1.79 |
2.1548 times |
Fri 31 October 2025 |
1.76 (0%) |
1.75 |
1.74 - 1.76 |
0.1868 times |
Fri 31 October 2025 |
1.76 (1.15%) |
1.76 |
1.70 - 1.82 |
0.6966 times |
Fri 24 October 2025 |
1.74 (0.58%) |
1.75 |
1.68 - 1.88 |
0.9853 times |
Fri 17 October 2025 |
1.73 (-0.57%) |
1.74 |
1.70 - 1.82 |
0.9478 times |
Fri 10 October 2025 |
1.74 (-4.92%) |
1.83 |
1.71 - 1.92 |
1.2721 times |
Fri 03 October 2025 |
1.83 (2.81%) |
1.78 |
1.70 - 1.84 |
1.2612 times |
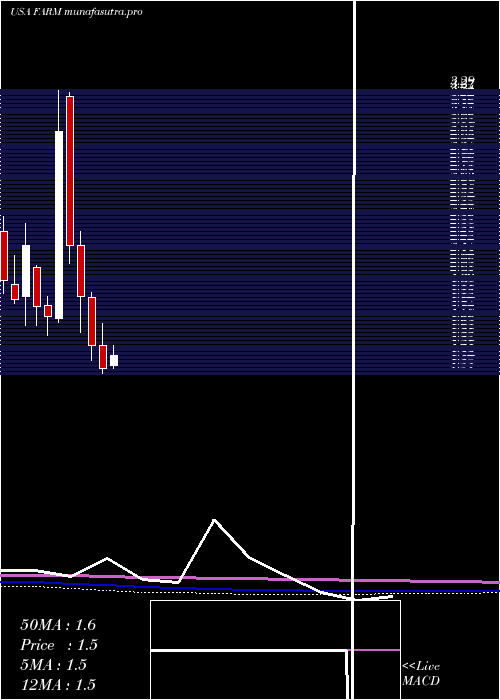
Monthly price and charts FarmerBrothers Strong monthly Stock price targets for FarmerBrothers FARM are 1.45 and 1.58 | Monthly Target 1 | 1.42 | | Monthly Target 2 | 1.48 | | Monthly Target 3 | 1.55 | | Monthly Target 4 | 1.61 | | Monthly Target 5 | 1.68 |
Monthly price and volumes Farmer Brothers
| Date |
Closing |
Open |
Range |
Volume |
Thu 04 December 2025 |
1.54 (-4.35%) |
1.59 |
1.49 - 1.62 |
0.065 times |
Fri 28 November 2025 |
1.61 (-8.52%) |
1.78 |
1.40 - 1.79 |
0.5702 times |
Fri 31 October 2025 |
1.76 (2.92%) |
1.70 |
1.68 - 1.92 |
0.499 times |
Tue 30 September 2025 |
1.71 (-14.5%) |
1.99 |
1.70 - 2.48 |
1.7387 times |
Fri 29 August 2025 |
2.00 (21.21%) |
1.63 |
1.59 - 2.06 |
0.6853 times |
Thu 31 July 2025 |
1.65 (20.44%) |
1.39 |
1.36 - 1.90 |
2.2639 times |
Mon 30 June 2025 |
1.37 (-10.46%) |
1.53 |
1.34 - 1.68 |
0.5426 times |
Fri 30 May 2025 |
1.53 (-18.18%) |
1.86 |
1.43 - 1.90 |
1.0393 times |
Wed 30 April 2025 |
1.87 (-15.77%) |
2.22 |
1.62 - 2.32 |
0.8046 times |
Mon 31 March 2025 |
2.22 (-26.25%) |
3.25 |
2.10 - 3.28 |
1.7915 times |
Fri 28 February 2025 |
3.01 (73.99%) |
1.72 |
1.69 - 3.29 |
14.4172 times |
DMA SMA EMA moving averages of Farmer Brothers FARM
DMA (daily moving average) of Farmer Brothers FARM
| DMA period | DMA value | | 5 day DMA | 1.56 | | 12 day DMA | 1.54 | | 20 day DMA | 1.53 | | 35 day DMA | 1.63 | | 50 day DMA | 1.67 | | 100 day DMA | 1.73 | | 150 day DMA | 1.66 | | 200 day DMA | 1.8 | EMA (exponential moving average) of Farmer Brothers FARM
| EMA period | EMA current | EMA prev | EMA prev2 | | 5 day EMA | 1.55 | 1.55 | 1.55 | | 12 day EMA | 1.56 | 1.56 | 1.56 | | 20 day EMA | 1.58 | 1.58 | 1.58 | | 35 day EMA | 1.62 | 1.62 | 1.62 | | 50 day EMA | 1.66 | 1.67 | 1.68 |
SMA (simple moving average) of Farmer Brothers FARM
| SMA period | SMA current | SMA prev | SMA prev2 | | 5 day SMA | 1.56 | 1.56 | 1.56 | | 12 day SMA | 1.54 | 1.54 | 1.53 | | 20 day SMA | 1.53 | 1.54 | 1.55 | | 35 day SMA | 1.63 | 1.63 | 1.64 | | 50 day SMA | 1.67 | 1.67 | 1.68 | | 100 day SMA | 1.73 | 1.73 | 1.73 | | 150 day SMA | 1.66 | 1.67 | 1.67 | | 200 day SMA | 1.8 | 1.8 | 1.8 |
|
|
