FirstAmerican FAF full analysis,charts,indicators,moving averages,SMA,DMA,EMA,ADX,MACD,RSIFirst American FAF WideScreen charts, DMA,SMA,EMA technical analysis, forecast prediction, by indicators ADX,MACD,RSI,CCI USA stock exchange
operates under Finance sector & deals in Specialty Insurers
Daily price and charts and targets FirstAmerican Strong Daily Stock price targets for FirstAmerican FAF are 60.45 and 61.79 | Daily Target 1 | 59.34 | | Daily Target 2 | 60.22 | | Daily Target 3 | 60.68 | | Daily Target 4 | 61.56 | | Daily Target 5 | 62.02 |
Daily price and volume First American
| Date |
Closing |
Open |
Range |
Volume |
Mon 20 October 2025 |
61.10 (2.23%) |
60.02 |
59.80 - 61.14 |
1.0788 times |
Fri 17 October 2025 |
59.77 (1.07%) |
59.38 |
58.51 - 59.95 |
1.1036 times |
Thu 16 October 2025 |
59.14 (-1.04%) |
59.16 |
58.60 - 59.55 |
1.2696 times |
Wed 15 October 2025 |
59.76 (-0.88%) |
60.04 |
59.44 - 60.22 |
0.7543 times |
Tue 14 October 2025 |
60.29 (2.15%) |
58.98 |
58.97 - 60.44 |
0.7543 times |
Mon 13 October 2025 |
59.02 (-0.54%) |
59.51 |
58.53 - 59.70 |
0.8594 times |
Fri 10 October 2025 |
59.34 (-0.55%) |
60.07 |
59.30 - 60.71 |
1.9961 times |
Thu 09 October 2025 |
59.67 (-1.83%) |
60.61 |
59.50 - 60.76 |
0.8956 times |
Wed 08 October 2025 |
60.78 (-0.3%) |
61.23 |
60.53 - 61.28 |
0.58 times |
Tue 07 October 2025 |
60.96 (-1.2%) |
61.84 |
60.67 - 62.44 |
0.7082 times |
Mon 06 October 2025 |
61.70 (-4.06%) |
63.99 |
61.67 - 64.28 |
0.4834 times |
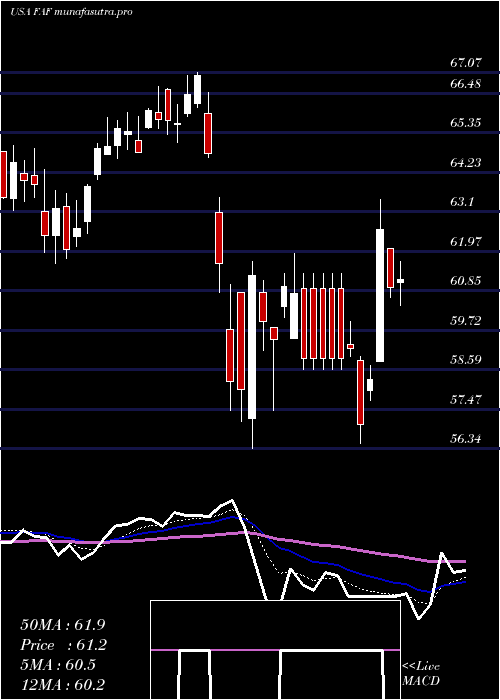
Weekly price and charts FirstAmerican Strong weekly Stock price targets for FirstAmerican FAF are 60.45 and 61.79 | Weekly Target 1 | 59.34 | | Weekly Target 2 | 60.22 | | Weekly Target 3 | 60.68 | | Weekly Target 4 | 61.56 | | Weekly Target 5 | 62.02 |
Weekly price and volumes for First American
| Date |
Closing |
Open |
Range |
Volume |
Mon 20 October 2025 |
61.10 (2.23%) |
60.02 |
59.80 - 61.14 |
0.2575 times |
Fri 17 October 2025 |
59.77 (0.72%) |
59.51 |
58.51 - 60.44 |
1.1316 times |
Fri 10 October 2025 |
59.34 (-7.73%) |
63.99 |
59.30 - 64.28 |
1.113 times |
Fri 03 October 2025 |
64.31 (-1.03%) |
65.05 |
62.72 - 65.16 |
0.9451 times |
Fri 26 September 2025 |
64.98 (-2.06%) |
65.70 |
63.85 - 66.21 |
1.0749 times |
Fri 19 September 2025 |
66.35 (-1.72%) |
67.68 |
65.81 - 68.07 |
1.8558 times |
Fri 12 September 2025 |
67.51 (0.67%) |
66.73 |
65.24 - 68.64 |
1.6051 times |
Fri 05 September 2025 |
67.06 (1.61%) |
64.65 |
63.85 - 67.36 |
0.8785 times |
Fri 29 August 2025 |
66.00 (0%) |
65.68 |
65.60 - 66.17 |
0.1758 times |
Fri 29 August 2025 |
66.00 (-0.69%) |
66.21 |
65.00 - 66.82 |
0.9627 times |
Fri 22 August 2025 |
66.46 (3.05%) |
64.44 |
63.82 - 67.03 |
0.8151 times |
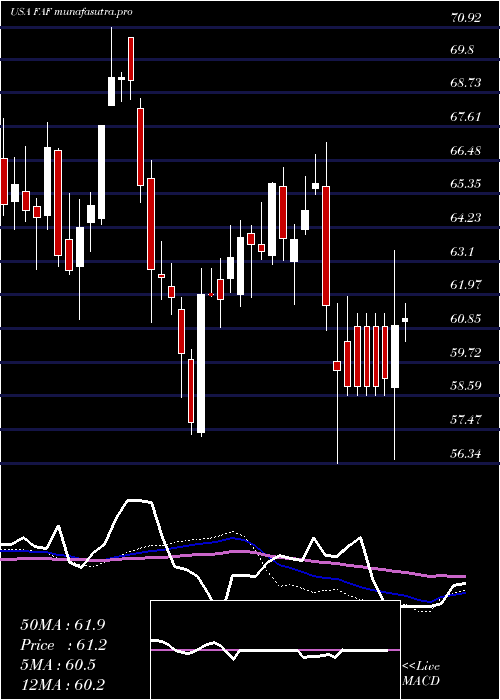
Monthly price and charts FirstAmerican Strong monthly Stock price targets for FirstAmerican FAF are 56.66 and 62.95 | Monthly Target 1 | 55.18 | | Monthly Target 2 | 58.14 | | Monthly Target 3 | 61.47 | | Monthly Target 4 | 64.43 | | Monthly Target 5 | 67.76 |
Monthly price and volumes First American
| Date |
Closing |
Open |
Range |
Volume |
Mon 20 October 2025 |
61.10 (-4.89%) |
64.61 |
58.51 - 64.80 |
0.4974 times |
Tue 30 September 2025 |
64.24 (-2.67%) |
64.65 |
63.62 - 68.64 |
0.9332 times |
Fri 29 August 2025 |
66.00 (9.91%) |
60.18 |
59.27 - 67.03 |
0.7069 times |
Thu 31 July 2025 |
60.05 (-2.18%) |
61.20 |
53.09 - 63.52 |
2.1024 times |
Mon 30 June 2025 |
61.39 (10%) |
55.18 |
54.41 - 61.90 |
1.305 times |
Fri 30 May 2025 |
55.81 (-8.22%) |
60.23 |
53.95 - 62.05 |
1.1399 times |
Wed 30 April 2025 |
60.81 (-7.34%) |
65.91 |
56.34 - 67.07 |
1.1477 times |
Mon 31 March 2025 |
65.63 (-0.09%) |
65.60 |
61.64 - 66.68 |
0.9621 times |
Fri 28 February 2025 |
65.69 (3.91%) |
62.00 |
61.59 - 65.72 |
0.5877 times |
Fri 31 January 2025 |
63.22 (1.25%) |
62.60 |
57.25 - 64.30 |
0.6177 times |
Tue 31 December 2024 |
62.44 (-9.83%) |
70.59 |
61.05 - 70.59 |
0.4836 times |

DMA SMA EMA moving averages of First American FAF
DMA (daily moving average) of First American FAF
| DMA period | DMA value | | 5 day DMA | 60.01 | | 12 day DMA | 60.49 | | 20 day DMA | 62.07 | | 35 day DMA | 63.99 | | 50 day DMA | 64.43 | | 100 day DMA | 61.67 | | 150 day DMA | 61.44 | | 200 day DMA | 61.78 | EMA (exponential moving average) of First American FAF
| EMA period | EMA current | EMA prev | EMA prev2 | | 5 day EMA | 60.19 | 59.74 | 59.72 | | 12 day EMA | 60.8 | 60.75 | 60.93 | | 20 day EMA | 61.73 | 61.8 | 62.01 | | 35 day EMA | 62.73 | 62.83 | 63.01 | | 50 day EMA | 63.86 | 63.97 | 64.14 |
SMA (simple moving average) of First American FAF
| SMA period | SMA current | SMA prev | SMA prev2 | | 5 day SMA | 60.01 | 59.6 | 59.51 | | 12 day SMA | 60.49 | 60.71 | 61.05 | | 20 day SMA | 62.07 | 62.29 | 62.62 | | 35 day SMA | 63.99 | 64.13 | 64.31 | | 50 day SMA | 64.43 | 64.47 | 64.53 | | 100 day SMA | 61.67 | 61.62 | 61.57 | | 150 day SMA | 61.44 | 61.46 | 61.49 | | 200 day SMA | 61.78 | 61.79 | 61.8 |
|
|
