ExponentInc EXPO full analysis,charts,indicators,moving averages,SMA,DMA,EMA,ADX,MACD,RSIExponent Inc EXPO WideScreen charts, DMA,SMA,EMA technical analysis, forecast prediction, by indicators ADX,MACD,RSI,CCI USA stock exchange
operates under Consumer Services sector & deals in Professional Services
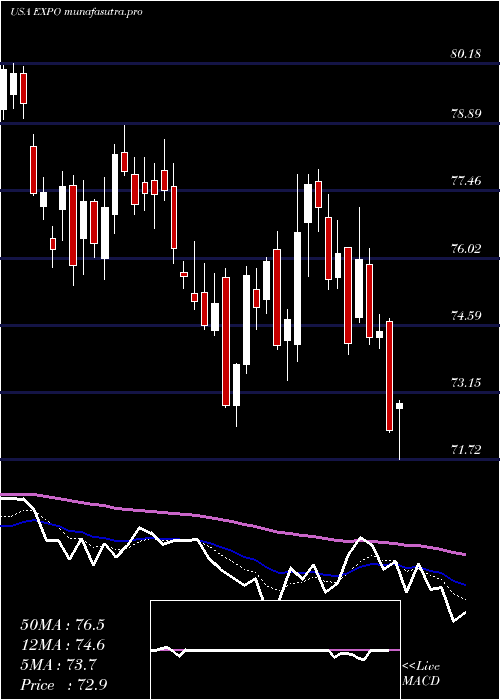
Daily price and charts and targets ExponentInc Strong Daily Stock price targets for ExponentInc EXPO are 73.97 and 75.44 | Daily Target 1 | 72.89 | | Daily Target 2 | 73.57 | | Daily Target 3 | 74.36 | | Daily Target 4 | 75.04 | | Daily Target 5 | 75.83 |
Daily price and volume Exponent Inc
| Date |
Closing |
Open |
Range |
Volume |
Thu 04 December 2025 |
74.25 (0.64%) |
74.04 |
73.68 - 75.15 |
0.9166 times |
Wed 03 December 2025 |
73.78 (0.76%) |
73.46 |
73.07 - 74.33 |
0.844 times |
Tue 02 December 2025 |
73.22 (0.14%) |
73.26 |
72.36 - 73.78 |
1.0053 times |
Mon 01 December 2025 |
73.12 (1.13%) |
72.13 |
71.97 - 73.33 |
1.6479 times |
Fri 28 November 2025 |
72.30 (-0.37%) |
72.37 |
72.04 - 72.64 |
0.7141 times |
Wed 26 November 2025 |
72.57 (0.23%) |
71.95 |
71.87 - 72.81 |
0.7762 times |
Tue 25 November 2025 |
72.40 (2.26%) |
71.19 |
71.19 - 72.95 |
1.1243 times |
Mon 24 November 2025 |
70.80 (0.24%) |
70.36 |
69.69 - 71.48 |
1.2625 times |
Fri 21 November 2025 |
70.63 (3%) |
68.68 |
68.47 - 70.97 |
0.8928 times |
Thu 20 November 2025 |
68.57 (0.56%) |
68.69 |
67.77 - 69.36 |
0.8163 times |
Wed 19 November 2025 |
68.19 (-0.83%) |
68.85 |
67.86 - 68.87 |
0.6536 times |
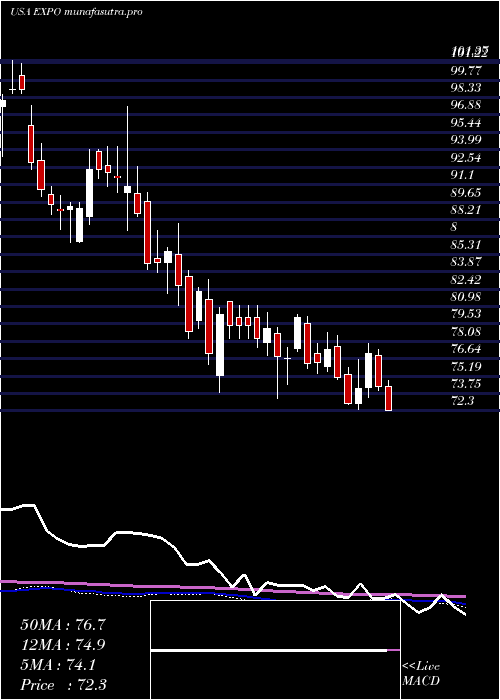
Weekly price and charts ExponentInc Strong weekly Stock price targets for ExponentInc EXPO are 73.11 and 76.29 | Weekly Target 1 | 70.61 | | Weekly Target 2 | 72.43 | | Weekly Target 3 | 73.79 | | Weekly Target 4 | 75.61 | | Weekly Target 5 | 76.97 |
Weekly price and volumes for Exponent Inc
| Date |
Closing |
Open |
Range |
Volume |
Thu 04 December 2025 |
74.25 (2.7%) |
72.13 |
71.97 - 75.15 |
1.0489 times |
Fri 28 November 2025 |
72.30 (2.36%) |
70.36 |
69.69 - 72.95 |
0.9214 times |
Fri 21 November 2025 |
70.63 (0.99%) |
70.20 |
67.77 - 71.85 |
1.1037 times |
Fri 14 November 2025 |
69.94 (-0.89%) |
70.88 |
68.54 - 71.50 |
0.9537 times |
Fri 07 November 2025 |
70.57 (-0.34%) |
71.96 |
70.05 - 73.88 |
0.8748 times |
Fri 31 October 2025 |
70.81 (0%) |
67.69 |
65.04 - 71.18 |
0.6519 times |
Fri 31 October 2025 |
70.81 (2.16%) |
69.30 |
64.99 - 71.18 |
1.7052 times |
Fri 24 October 2025 |
69.31 (2.68%) |
67.70 |
67.48 - 70.42 |
0.7024 times |
Fri 17 October 2025 |
67.50 (3.42%) |
65.60 |
65.00 - 68.34 |
1.0852 times |
Fri 10 October 2025 |
65.27 (-2.73%) |
67.37 |
64.39 - 68.03 |
0.9529 times |
Fri 03 October 2025 |
67.10 (-3.45%) |
69.77 |
66.83 - 69.82 |
1.052 times |
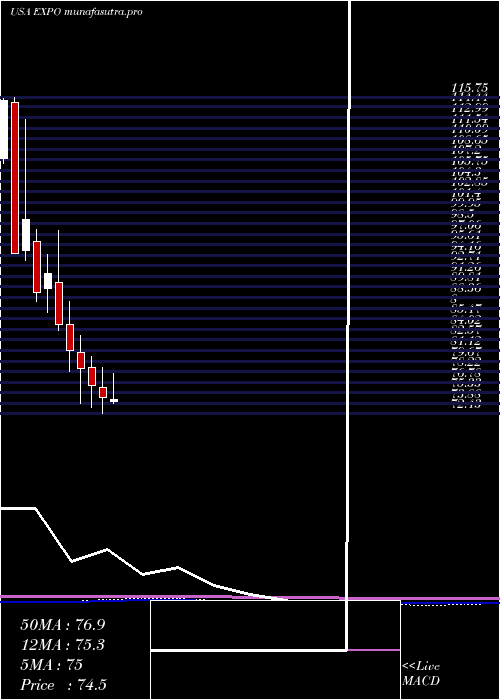
Monthly price and charts ExponentInc Strong monthly Stock price targets for ExponentInc EXPO are 73.11 and 76.29 | Monthly Target 1 | 70.61 | | Monthly Target 2 | 72.43 | | Monthly Target 3 | 73.79 | | Monthly Target 4 | 75.61 | | Monthly Target 5 | 76.97 |
Monthly price and volumes Exponent Inc
| Date |
Closing |
Open |
Range |
Volume |
Thu 04 December 2025 |
74.25 (2.7%) |
72.13 |
71.97 - 75.15 |
0.2549 times |
Fri 28 November 2025 |
72.30 (2.1%) |
71.96 |
67.77 - 73.88 |
0.9365 times |
Fri 31 October 2025 |
70.81 (1.91%) |
69.30 |
64.39 - 71.18 |
1.3623 times |
Tue 30 September 2025 |
69.48 (-2.66%) |
71.00 |
68.30 - 73.55 |
1.4019 times |
Fri 29 August 2025 |
71.38 (3.51%) |
67.88 |
63.81 - 73.25 |
1.3441 times |
Thu 31 July 2025 |
68.96 (-7.7%) |
74.18 |
67.69 - 77.92 |
0.8908 times |
Mon 30 June 2025 |
74.71 (-2.14%) |
76.02 |
72.43 - 78.85 |
0.8852 times |
Fri 30 May 2025 |
76.34 (-2.97%) |
78.75 |
73.37 - 80.33 |
0.9131 times |
Wed 30 April 2025 |
78.68 (-2.94%) |
80.78 |
73.83 - 83.19 |
1.1024 times |
Mon 31 March 2025 |
81.06 (-4.25%) |
84.66 |
78.30 - 87.88 |
0.9088 times |
Fri 28 February 2025 |
84.66 (-7.65%) |
90.45 |
83.79 - 97.57 |
0.7443 times |
DMA SMA EMA moving averages of Exponent Inc EXPO
DMA (daily moving average) of Exponent Inc EXPO
| DMA period | DMA value | | 5 day DMA | 73.33 | | 12 day DMA | 71.55 | | 20 day DMA | 71.05 | | 35 day DMA | 70.22 | | 50 day DMA | 69.41 | | 100 day DMA | 70.13 | | 150 day DMA | 72.24 | | 200 day DMA | 74.54 | EMA (exponential moving average) of Exponent Inc EXPO
| EMA period | EMA current | EMA prev | EMA prev2 | | 5 day EMA | 73.37 | 72.93 | 72.51 | | 12 day EMA | 72.21 | 71.84 | 71.49 | | 20 day EMA | 71.45 | 71.16 | 70.88 | | 35 day EMA | 70.52 | 70.3 | 70.09 | | 50 day EMA | 69.81 | 69.63 | 69.46 |
SMA (simple moving average) of Exponent Inc EXPO
| SMA period | SMA current | SMA prev | SMA prev2 | | 5 day SMA | 73.33 | 73 | 72.72 | | 12 day SMA | 71.55 | 71.1 | 70.78 | | 20 day SMA | 71.05 | 71.03 | 70.92 | | 35 day SMA | 70.22 | 70.02 | 69.82 | | 50 day SMA | 69.41 | 69.3 | 69.2 | | 100 day SMA | 70.13 | 70.11 | 70.12 | | 150 day SMA | 72.24 | 72.27 | 72.3 | | 200 day SMA | 74.54 | 74.62 | 74.7 |
|
|
