ExpeditorsInternational EXPD full analysis,charts,indicators,moving averages,SMA,DMA,EMA,ADX,MACD,RSIExpeditors International EXPD WideScreen charts, DMA,SMA,EMA technical analysis, forecast prediction, by indicators ADX,MACD,RSI,CCI USA stock exchange
operates under Transportation sector & deals in Oil Refining Marketing
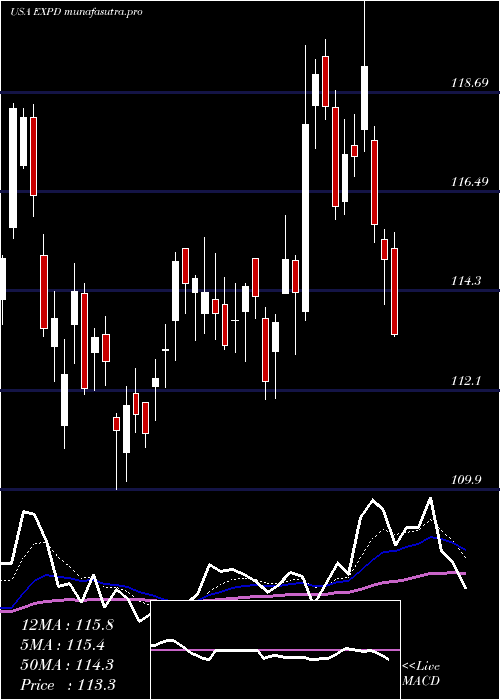
Daily price and charts and targets ExpeditorsInternational Strong Daily Stock price targets for ExpeditorsInternational EXPD are 149.23 and 152.54 | Daily Target 1 | 146.59 | | Daily Target 2 | 148.55 | | Daily Target 3 | 149.90333333333 | | Daily Target 4 | 151.86 | | Daily Target 5 | 153.21 |
Daily price and volume Expeditors International
| Date |
Closing |
Open |
Range |
Volume |
Thu 04 December 2025 |
150.50 (1.63%) |
147.95 |
147.95 - 151.26 |
1.4094 times |
Wed 03 December 2025 |
148.09 (1.1%) |
146.55 |
145.57 - 148.66 |
0.8473 times |
Tue 02 December 2025 |
146.48 (0.02%) |
146.84 |
144.93 - 147.10 |
0.6633 times |
Mon 01 December 2025 |
146.45 (-0.31%) |
145.48 |
145.08 - 147.87 |
0.8801 times |
Fri 28 November 2025 |
146.90 (-0.31%) |
147.50 |
146.66 - 147.50 |
0.3795 times |
Wed 26 November 2025 |
147.36 (-0.15%) |
146.73 |
146.50 - 147.94 |
0.9854 times |
Tue 25 November 2025 |
147.58 (2.3%) |
145.02 |
145.00 - 148.38 |
1.031 times |
Mon 24 November 2025 |
144.26 (0.73%) |
143.46 |
142.87 - 146.27 |
1.8048 times |
Fri 21 November 2025 |
143.21 (3.55%) |
139.50 |
139.15 - 143.83 |
1.2641 times |
Thu 20 November 2025 |
138.30 (-0.6%) |
140.51 |
138.22 - 141.08 |
0.7352 times |
Wed 19 November 2025 |
139.13 (-0.56%) |
140.43 |
138.92 - 140.95 |
0.851 times |
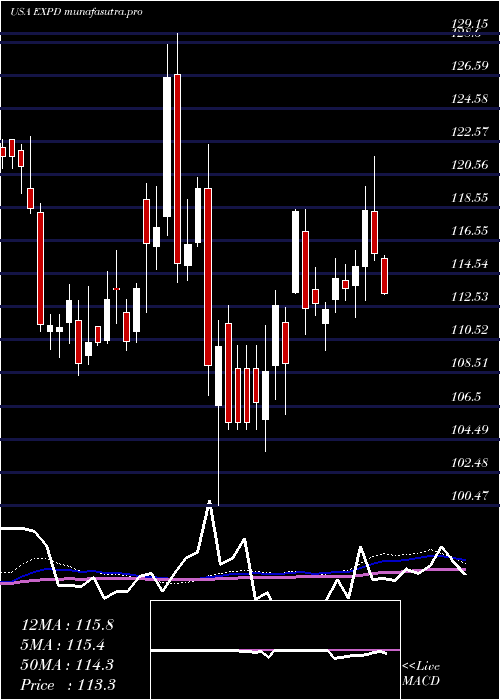
Weekly price and charts ExpeditorsInternational Strong weekly Stock price targets for ExpeditorsInternational EXPD are 147.72 and 154.05 | Weekly Target 1 | 142.57 | | Weekly Target 2 | 146.53 | | Weekly Target 3 | 148.89666666667 | | Weekly Target 4 | 152.86 | | Weekly Target 5 | 155.23 |
Weekly price and volumes for Expeditors International
| Date |
Closing |
Open |
Range |
Volume |
Thu 04 December 2025 |
150.50 (2.45%) |
145.48 |
144.93 - 151.26 |
0.9223 times |
Fri 28 November 2025 |
146.90 (2.58%) |
143.46 |
142.87 - 148.38 |
1.0195 times |
Fri 21 November 2025 |
143.21 (3.46%) |
140.46 |
138.22 - 143.83 |
1.4059 times |
Fri 14 November 2025 |
138.42 (0.72%) |
137.14 |
136.88 - 142.09 |
1.3495 times |
Fri 07 November 2025 |
137.43 (12.74%) |
129.89 |
128.10 - 140.72 |
2.1901 times |
Fri 31 October 2025 |
121.90 (0%) |
119.35 |
118.94 - 122.79 |
0.2867 times |
Fri 31 October 2025 |
121.90 (3.47%) |
118.73 |
117.45 - 122.79 |
0.9963 times |
Fri 24 October 2025 |
117.81 (-1.76%) |
120.12 |
116.84 - 121.92 |
0.6463 times |
Fri 17 October 2025 |
119.92 (-1.93%) |
113.42 |
113.06 - 120.25 |
0.9347 times |
Tue 07 October 2025 |
122.28 (-1%) |
123.27 |
122.08 - 124.15 |
0.2488 times |
Fri 03 October 2025 |
123.52 (1.38%) |
122.56 |
120.78 - 125.31 |
0.9114 times |
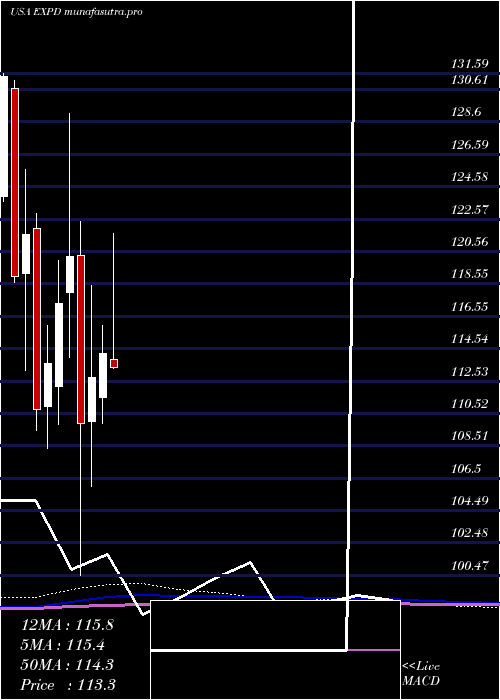
Monthly price and charts ExpeditorsInternational Strong monthly Stock price targets for ExpeditorsInternational EXPD are 147.72 and 154.05 | Monthly Target 1 | 142.57 | | Monthly Target 2 | 146.53 | | Monthly Target 3 | 148.89666666667 | | Monthly Target 4 | 152.86 | | Monthly Target 5 | 155.23 |
Monthly price and volumes Expeditors International
| Date |
Closing |
Open |
Range |
Volume |
Thu 04 December 2025 |
150.50 (2.45%) |
145.48 |
144.93 - 151.26 |
0.2002 times |
Fri 28 November 2025 |
146.90 (20.51%) |
129.89 |
128.10 - 148.38 |
1.2948 times |
Fri 31 October 2025 |
121.90 (-0.56%) |
122.35 |
113.06 - 125.31 |
0.7698 times |
Tue 30 September 2025 |
122.59 (1.7%) |
119.38 |
118.84 - 127.16 |
1.0203 times |
Fri 29 August 2025 |
120.54 (3.7%) |
116.25 |
113.25 - 122.50 |
0.9937 times |
Thu 31 July 2025 |
116.24 (1.74%) |
113.84 |
110.48 - 121.69 |
1.0124 times |
Mon 30 June 2025 |
114.25 (1.35%) |
111.50 |
109.90 - 115.96 |
0.8783 times |
Fri 30 May 2025 |
112.73 (2.57%) |
110.03 |
106.00 - 118.44 |
1.3011 times |
Wed 30 April 2025 |
109.91 (-8.6%) |
120.34 |
100.47 - 122.40 |
1.2172 times |
Mon 31 March 2025 |
120.25 (2.46%) |
118.00 |
114.00 - 129.15 |
1.3122 times |
Fri 28 February 2025 |
117.36 (3.33%) |
112.17 |
109.85 - 120.01 |
1.0592 times |
DMA SMA EMA moving averages of Expeditors International EXPD
DMA (daily moving average) of Expeditors International EXPD
| DMA period | DMA value | | 5 day DMA | 147.68 | | 12 day DMA | 144.85 | | 20 day DMA | 142.49 | | 35 day DMA | 133.68 | | 50 day DMA | 129.83 | | 100 day DMA | 124.3 | | 150 day DMA | 120.73 | | 200 day DMA | 119.12 | EMA (exponential moving average) of Expeditors International EXPD
| EMA period | EMA current | EMA prev | EMA prev2 | | 5 day EMA | 147.99 | 146.74 | 146.07 | | 12 day EMA | 145.11 | 144.13 | 143.41 | | 20 day EMA | 141.78 | 140.86 | 140.1 | | 35 day EMA | 136.76 | 135.95 | 135.23 | | 50 day EMA | 131.11 | 130.32 | 129.59 |
SMA (simple moving average) of Expeditors International EXPD
| SMA period | SMA current | SMA prev | SMA prev2 | | 5 day SMA | 147.68 | 147.06 | 146.95 | | 12 day SMA | 144.85 | 144.16 | 143.35 | | 20 day SMA | 142.49 | 141.86 | 141.25 | | 35 day SMA | 133.68 | 132.73 | 131.85 | | 50 day SMA | 129.83 | 129.22 | 128.74 | | 100 day SMA | 124.3 | 123.99 | 123.68 | | 150 day SMA | 120.73 | 120.45 | 120.2 | | 200 day SMA | 119.12 | 118.92 | 118.74 |
|
|
