ExelonCorporation EXC full analysis,charts,indicators,moving averages,SMA,DMA,EMA,ADX,MACD,RSIExelon Corporation EXC WideScreen charts, DMA,SMA,EMA technical analysis, forecast prediction, by indicators ADX,MACD,RSI,CCI USA stock exchange
operates under Public Utilities sector & deals in Power Generation
Daily price and charts and targets ExelonCorporation Strong Daily Stock price targets for ExelonCorporation EXC are 47.97 and 48.57 | Daily Target 1 | 47.47 | | Daily Target 2 | 47.86 | | Daily Target 3 | 48.073333333333 | | Daily Target 4 | 48.46 | | Daily Target 5 | 48.67 |
Daily price and volume Exelon Corporation
| Date |
Closing |
Open |
Range |
Volume |
Mon 20 October 2025 |
48.24 (0.96%) |
48.05 |
47.69 - 48.29 |
0.7949 times |
Fri 17 October 2025 |
47.78 (0.89%) |
47.54 |
47.36 - 48.06 |
1.3443 times |
Thu 16 October 2025 |
47.36 (-0.98%) |
47.73 |
47.26 - 48.07 |
0.9378 times |
Wed 15 October 2025 |
47.83 (0.95%) |
47.46 |
47.38 - 47.88 |
1.0608 times |
Tue 14 October 2025 |
47.38 (1.13%) |
47.32 |
47.17 - 47.63 |
0.9247 times |
Mon 13 October 2025 |
46.85 (-0.47%) |
46.98 |
46.50 - 47.10 |
0.9241 times |
Fri 10 October 2025 |
47.07 (0.88%) |
46.74 |
46.65 - 47.35 |
1.0642 times |
Thu 09 October 2025 |
46.66 (0.09%) |
46.75 |
46.52 - 46.97 |
0.8017 times |
Wed 08 October 2025 |
46.62 (-0.36%) |
46.90 |
46.06 - 46.92 |
0.9288 times |
Tue 07 October 2025 |
46.79 (2.74%) |
46.30 |
45.89 - 47.06 |
1.2185 times |
Mon 06 October 2025 |
45.54 (0.44%) |
45.40 |
45.12 - 45.75 |
0.9094 times |
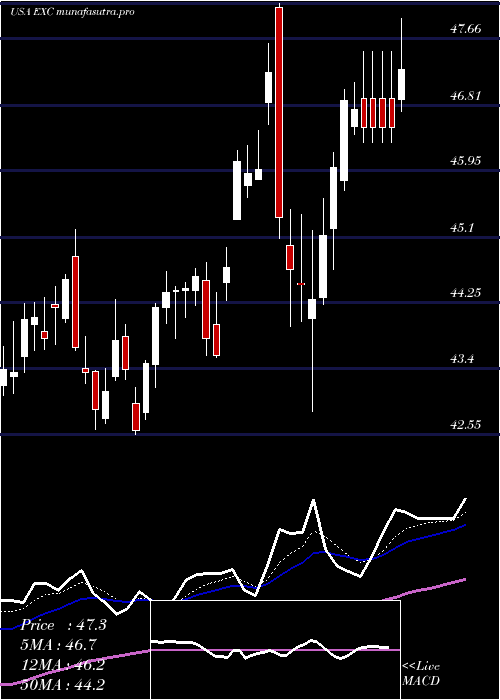
Weekly price and charts ExelonCorporation Strong weekly Stock price targets for ExelonCorporation EXC are 47.97 and 48.57 | Weekly Target 1 | 47.47 | | Weekly Target 2 | 47.86 | | Weekly Target 3 | 48.073333333333 | | Weekly Target 4 | 48.46 | | Weekly Target 5 | 48.67 |
Weekly price and volumes for Exelon Corporation
| Date |
Closing |
Open |
Range |
Volume |
Mon 20 October 2025 |
48.24 (0.96%) |
48.05 |
47.69 - 48.29 |
0.1923 times |
Fri 17 October 2025 |
47.78 (1.51%) |
46.98 |
46.50 - 48.07 |
1.2561 times |
Fri 10 October 2025 |
47.07 (3.82%) |
45.40 |
45.12 - 47.35 |
1.191 times |
Fri 03 October 2025 |
45.34 (2.84%) |
43.94 |
43.50 - 45.64 |
1.4515 times |
Fri 26 September 2025 |
44.09 (1.57%) |
43.35 |
43.22 - 44.67 |
1.1425 times |
Fri 19 September 2025 |
43.41 (0.07%) |
43.37 |
42.58 - 43.67 |
1.4575 times |
Fri 12 September 2025 |
43.38 (-0.12%) |
43.53 |
42.75 - 43.63 |
0.9201 times |
Fri 05 September 2025 |
43.43 (-0.57%) |
43.63 |
42.90 - 43.98 |
0.979 times |
Fri 29 August 2025 |
43.68 (0%) |
43.79 |
43.54 - 43.89 |
0.1724 times |
Fri 29 August 2025 |
43.68 (-2.85%) |
44.91 |
43.54 - 44.97 |
1.2377 times |
Fri 22 August 2025 |
44.96 (0.85%) |
44.60 |
43.87 - 45.47 |
1.1698 times |

Monthly price and charts ExelonCorporation Strong monthly Stock price targets for ExelonCorporation EXC are 46.4 and 50.14 | Monthly Target 1 | 43.29 | | Monthly Target 2 | 45.76 | | Monthly Target 3 | 47.026666666667 | | Monthly Target 4 | 49.5 | | Monthly Target 5 | 50.77 |
Monthly price and volumes Exelon Corporation
| Date |
Closing |
Open |
Range |
Volume |
Mon 20 October 2025 |
48.24 (7.18%) |
45.48 |
44.55 - 48.29 |
0.5995 times |
Tue 30 September 2025 |
45.01 (3.04%) |
43.63 |
42.58 - 45.06 |
0.8541 times |
Fri 29 August 2025 |
43.68 (-2.8%) |
45.51 |
43.54 - 45.78 |
0.8861 times |
Thu 31 July 2025 |
44.94 (3.5%) |
43.90 |
42.47 - 44.97 |
0.8735 times |
Mon 30 June 2025 |
43.42 (-0.91%) |
43.58 |
42.11 - 43.89 |
0.8631 times |
Fri 30 May 2025 |
43.82 (-6.57%) |
46.63 |
41.71 - 47.13 |
1.1796 times |
Wed 30 April 2025 |
46.90 (1.78%) |
45.76 |
42.85 - 48.11 |
1.4833 times |
Mon 31 March 2025 |
46.08 (4.25%) |
44.05 |
42.55 - 46.22 |
1.0719 times |
Fri 28 February 2025 |
44.20 (10.5%) |
39.86 |
39.67 - 44.46 |
1.1621 times |
Fri 31 January 2025 |
40.00 (6.27%) |
37.91 |
37.13 - 40.86 |
1.0268 times |
Tue 31 December 2024 |
37.64 (-4.68%) |
37.79 |
35.94 - 37.97 |
0.7295 times |

DMA SMA EMA moving averages of Exelon Corporation EXC
DMA (daily moving average) of Exelon Corporation EXC
| DMA period | DMA value | | 5 day DMA | 47.72 | | 12 day DMA | 46.96 | | 20 day DMA | 45.95 | | 35 day DMA | 44.81 | | 50 day DMA | 44.7 | | 100 day DMA | 44.09 | | 150 day DMA | 44.49 | | 200 day DMA | 43.64 | EMA (exponential moving average) of Exelon Corporation EXC
| EMA period | EMA current | EMA prev | EMA prev2 | | 5 day EMA | 47.7 | 47.43 | 47.25 | | 12 day EMA | 46.95 | 46.71 | 46.51 | | 20 day EMA | 46.28 | 46.07 | 45.89 | | 35 day EMA | 45.64 | 45.49 | 45.35 | | 50 day EMA | 45.04 | 44.91 | 44.79 |
SMA (simple moving average) of Exelon Corporation EXC
| SMA period | SMA current | SMA prev | SMA prev2 | | 5 day SMA | 47.72 | 47.44 | 47.3 | | 12 day SMA | 46.96 | 46.68 | 46.45 | | 20 day SMA | 45.95 | 45.71 | 45.49 | | 35 day SMA | 44.81 | 44.68 | 44.56 | | 50 day SMA | 44.7 | 44.63 | 44.58 | | 100 day SMA | 44.09 | 44.04 | 44 | | 150 day SMA | 44.49 | 44.46 | 44.42 | | 200 day SMA | 43.64 | 43.59 | 43.54 |
|
|
