EdwardsLifesciences EW full analysis,charts,indicators,moving averages,SMA,DMA,EMA,ADX,MACD,RSIEdwards Lifesciences EW WideScreen charts, DMA,SMA,EMA technical analysis, forecast prediction, by indicators ADX,MACD,RSI,CCI USA stock exchange
operates under Health Care sector & deals in Industrial Specialties
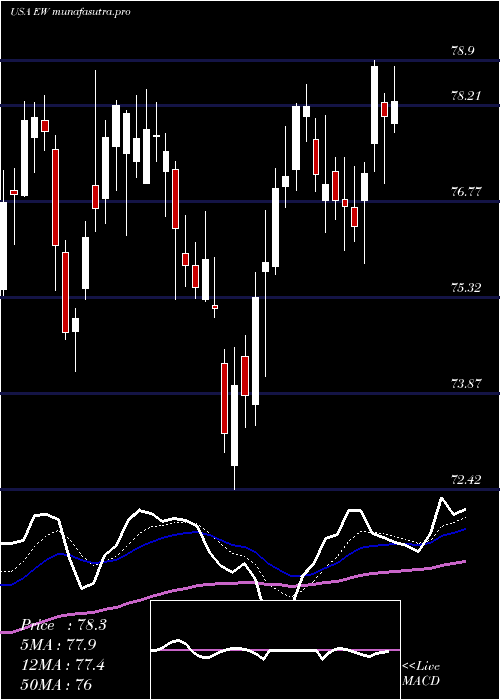
Daily price and charts and targets EdwardsLifesciences Strong Daily Stock price targets for EdwardsLifesciences EW are 84.88 and 86.86 | Daily Target 1 | 83.26 | | Daily Target 2 | 84.52 | | Daily Target 3 | 85.24 | | Daily Target 4 | 86.5 | | Daily Target 5 | 87.22 |
Daily price and volume Edwards Lifesciences
| Date |
Closing |
Open |
Range |
Volume |
Thu 04 December 2025 |
85.78 (2.14%) |
84.12 |
83.98 - 85.96 |
1.0406 times |
Wed 03 December 2025 |
83.98 (-0.86%) |
84.73 |
83.94 - 85.05 |
0.6542 times |
Tue 02 December 2025 |
84.71 (-0.66%) |
85.35 |
83.60 - 85.35 |
0.9618 times |
Mon 01 December 2025 |
85.27 (-1.62%) |
86.60 |
85.18 - 86.93 |
0.7617 times |
Fri 28 November 2025 |
86.67 (-0.09%) |
87.08 |
86.36 - 87.19 |
0.3875 times |
Wed 26 November 2025 |
86.75 (-0.08%) |
86.80 |
86.55 - 87.40 |
0.6267 times |
Tue 25 November 2025 |
86.82 (2.49%) |
84.66 |
84.66 - 86.94 |
0.9093 times |
Mon 24 November 2025 |
84.71 (-0.49%) |
84.88 |
83.81 - 85.56 |
2.2262 times |
Fri 21 November 2025 |
85.13 (1.24%) |
84.38 |
84.28 - 85.66 |
1.3966 times |
Thu 20 November 2025 |
84.09 (-2.24%) |
86.02 |
84.02 - 86.86 |
1.0355 times |
Wed 19 November 2025 |
86.02 (2.36%) |
84.04 |
83.32 - 86.03 |
1.2884 times |
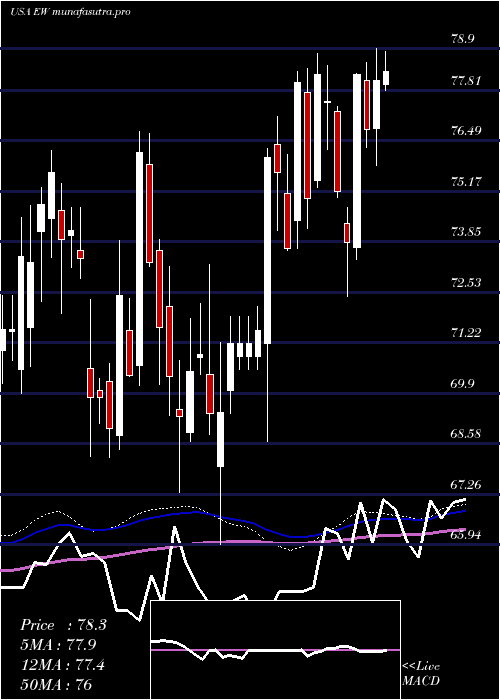
Weekly price and charts EdwardsLifesciences Strong weekly Stock price targets for EdwardsLifesciences EW are 83.03 and 86.36 | Weekly Target 1 | 82.11 | | Weekly Target 2 | 83.94 | | Weekly Target 3 | 85.436666666667 | | Weekly Target 4 | 87.27 | | Weekly Target 5 | 88.77 |
Weekly price and volumes for Edwards Lifesciences
| Date |
Closing |
Open |
Range |
Volume |
Thu 04 December 2025 |
85.78 (-1.03%) |
86.60 |
83.60 - 86.93 |
0.617 times |
Fri 28 November 2025 |
86.67 (1.81%) |
84.88 |
83.81 - 87.40 |
0.749 times |
Fri 21 November 2025 |
85.13 (-1.36%) |
85.92 |
83.32 - 86.86 |
1.0424 times |
Fri 14 November 2025 |
86.30 (3.49%) |
82.55 |
82.01 - 87.21 |
0.8603 times |
Fri 07 November 2025 |
83.39 (1.14%) |
83.05 |
81.69 - 84.83 |
0.7661 times |
Fri 31 October 2025 |
82.45 (0%) |
84.48 |
81.49 - 87.09 |
0.5985 times |
Fri 31 October 2025 |
82.45 (8.34%) |
76.00 |
75.48 - 87.09 |
2.4513 times |
Fri 24 October 2025 |
76.10 (2.15%) |
74.69 |
74.43 - 78.33 |
1.0559 times |
Fri 17 October 2025 |
74.50 (0.76%) |
73.17 |
72.30 - 74.81 |
0.9466 times |
Fri 10 October 2025 |
73.94 (-4.06%) |
77.13 |
73.16 - 78.04 |
0.9129 times |
Fri 03 October 2025 |
77.07 (1.08%) |
76.34 |
73.90 - 78.37 |
1.1351 times |
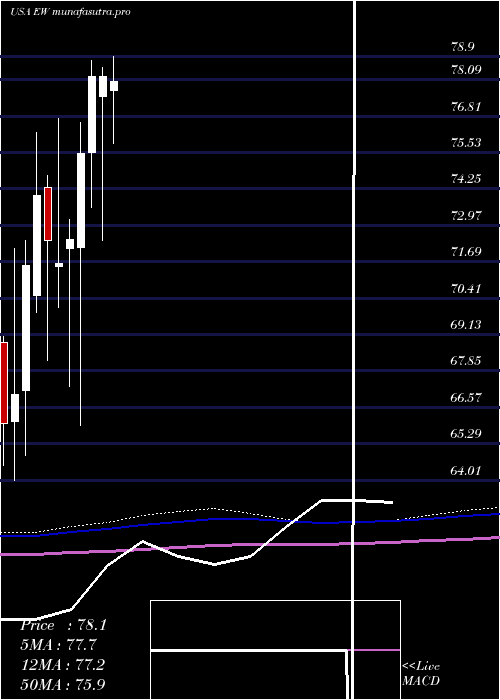
Monthly price and charts EdwardsLifesciences Strong monthly Stock price targets for EdwardsLifesciences EW are 83.03 and 86.36 | Monthly Target 1 | 82.11 | | Monthly Target 2 | 83.94 | | Monthly Target 3 | 85.436666666667 | | Monthly Target 4 | 87.27 | | Monthly Target 5 | 88.77 |
Monthly price and volumes Edwards Lifesciences
| Date |
Closing |
Open |
Range |
Volume |
Thu 04 December 2025 |
85.78 (-1.03%) |
86.60 |
83.60 - 86.93 |
0.1406 times |
Fri 28 November 2025 |
86.67 (5.12%) |
83.05 |
81.69 - 87.40 |
0.7789 times |
Fri 31 October 2025 |
82.45 (6.02%) |
77.79 |
72.30 - 87.09 |
1.5151 times |
Tue 30 September 2025 |
77.77 (-4.39%) |
80.75 |
73.05 - 82.67 |
1.1206 times |
Fri 29 August 2025 |
81.34 (2.56%) |
79.02 |
76.07 - 82.26 |
0.9333 times |
Thu 31 July 2025 |
79.31 (1.41%) |
77.70 |
75.30 - 83.00 |
1.2507 times |
Mon 30 June 2025 |
78.21 (-0.01%) |
77.49 |
72.42 - 78.53 |
0.8526 times |
Fri 30 May 2025 |
78.22 (3.62%) |
75.54 |
73.61 - 78.75 |
1.1366 times |
Wed 30 April 2025 |
75.49 (4.15%) |
72.18 |
65.94 - 76.60 |
1.2061 times |
Mon 31 March 2025 |
72.48 (1.2%) |
72.16 |
67.32 - 73.19 |
1.0655 times |
Fri 28 February 2025 |
71.62 (-1.15%) |
71.53 |
70.10 - 76.73 |
0.9462 times |
DMA SMA EMA moving averages of Edwards Lifesciences EW
DMA (daily moving average) of Edwards Lifesciences EW
| DMA period | DMA value | | 5 day DMA | 85.28 | | 12 day DMA | 85.33 | | 20 day DMA | 85.09 | | 35 day DMA | 82.59 | | 50 day DMA | 80.49 | | 100 day DMA | 79.47 | | 150 day DMA | 78.45 | | 200 day DMA | 76.67 | EMA (exponential moving average) of Edwards Lifesciences EW
| EMA period | EMA current | EMA prev | EMA prev2 | | 5 day EMA | 85.25 | 84.98 | 85.48 | | 12 day EMA | 85.16 | 85.05 | 85.24 | | 20 day EMA | 84.5 | 84.36 | 84.4 | | 35 day EMA | 82.6 | 82.41 | 82.32 | | 50 day EMA | 80.46 | 80.24 | 80.09 |
SMA (simple moving average) of Edwards Lifesciences EW
| SMA period | SMA current | SMA prev | SMA prev2 | | 5 day SMA | 85.28 | 85.48 | 86.04 | | 12 day SMA | 85.33 | 85.24 | 85.44 | | 20 day SMA | 85.09 | 84.94 | 84.95 | | 35 day SMA | 82.59 | 82.23 | 81.92 | | 50 day SMA | 80.49 | 80.27 | 80.08 | | 100 day SMA | 79.47 | 79.38 | 79.32 | | 150 day SMA | 78.45 | 78.38 | 78.33 | | 200 day SMA | 76.67 | 76.62 | 76.58 |
|
|
