EvergyInc EVRG full analysis,charts,indicators,moving averages,SMA,DMA,EMA,ADX,MACD,RSIEvergy Inc EVRG WideScreen charts, DMA,SMA,EMA technical analysis, forecast prediction, by indicators ADX,MACD,RSI,CCI USA stock exchange
operates under Public Utilities sector & deals in Power Generation
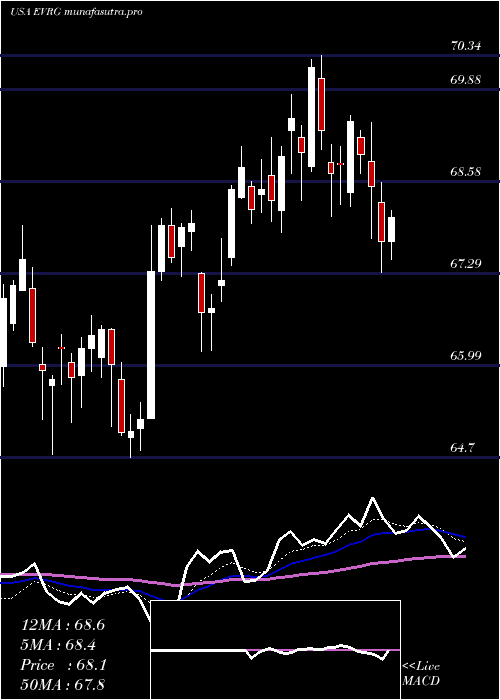
Daily price and charts and targets EvergyInc Strong Daily Stock price targets for EvergyInc EVRG are 73.31 and 74.17 | Daily Target 1 | 73.14 | | Daily Target 2 | 73.47 | | Daily Target 3 | 73.996666666667 | | Daily Target 4 | 74.33 | | Daily Target 5 | 74.86 |
Daily price and volume Evergy Inc
| Date |
Closing |
Open |
Range |
Volume |
Thu 04 December 2025 |
73.81 (-0.65%) |
73.96 |
73.66 - 74.52 |
1.0145 times |
Wed 03 December 2025 |
74.29 (-0.32%) |
74.56 |
74.02 - 74.93 |
1.0163 times |
Tue 02 December 2025 |
74.53 (-1.31%) |
75.55 |
74.36 - 75.61 |
0.9858 times |
Mon 01 December 2025 |
75.52 (-2.74%) |
77.41 |
75.40 - 77.48 |
1.0803 times |
Fri 28 November 2025 |
77.65 (0.7%) |
77.11 |
76.86 - 77.71 |
0.3754 times |
Wed 26 November 2025 |
77.11 (0.71%) |
76.74 |
76.69 - 77.38 |
0.8404 times |
Tue 25 November 2025 |
76.57 (-0.58%) |
77.27 |
76.06 - 77.46 |
0.8419 times |
Mon 24 November 2025 |
77.02 (1.54%) |
75.91 |
75.63 - 77.41 |
1.6256 times |
Fri 21 November 2025 |
75.85 (0.17%) |
75.30 |
74.90 - 75.95 |
1.2412 times |
Thu 20 November 2025 |
75.72 (0.13%) |
76.04 |
75.49 - 76.58 |
0.9785 times |
Wed 19 November 2025 |
75.62 (-1.45%) |
76.73 |
75.52 - 76.88 |
0.9471 times |
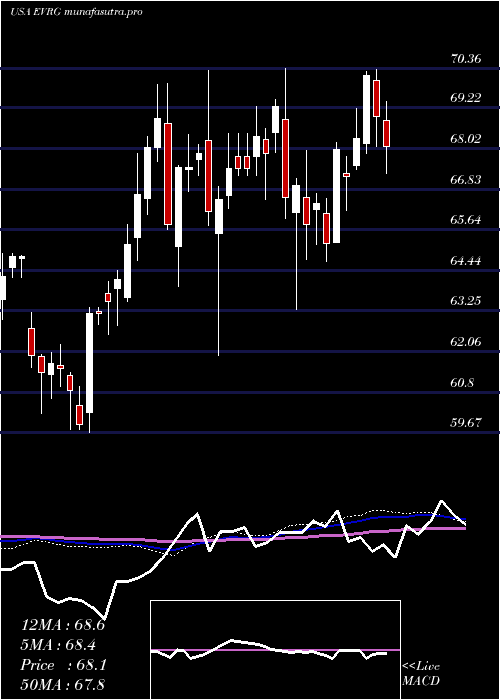
Weekly price and charts EvergyInc Strong weekly Stock price targets for EvergyInc EVRG are 71.83 and 75.65 | Weekly Target 1 | 71.16 | | Weekly Target 2 | 72.49 | | Weekly Target 3 | 74.983333333333 | | Weekly Target 4 | 76.31 | | Weekly Target 5 | 78.8 |
Weekly price and volumes for Evergy Inc
| Date |
Closing |
Open |
Range |
Volume |
Thu 04 December 2025 |
73.81 (-4.95%) |
77.41 |
73.66 - 77.48 |
0.7714 times |
Fri 28 November 2025 |
77.65 (2.37%) |
75.91 |
75.63 - 77.71 |
0.6935 times |
Fri 21 November 2025 |
75.85 (-0.81%) |
76.84 |
74.90 - 77.51 |
0.9034 times |
Fri 14 November 2025 |
76.47 (1.16%) |
76.00 |
75.32 - 77.46 |
1.278 times |
Fri 07 November 2025 |
75.59 (-1.59%) |
77.50 |
74.76 - 77.64 |
1.4834 times |
Fri 31 October 2025 |
76.81 (0%) |
77.42 |
76.66 - 77.42 |
0.3286 times |
Fri 31 October 2025 |
76.81 (-1.48%) |
78.02 |
76.66 - 78.73 |
1.3592 times |
Fri 24 October 2025 |
77.96 (-0.03%) |
78.35 |
77.56 - 79.14 |
0.968 times |
Fri 17 October 2025 |
77.98 (0.66%) |
77.52 |
77.04 - 79.32 |
0.986 times |
Fri 10 October 2025 |
77.47 (1.11%) |
76.64 |
76.63 - 78.56 |
1.2285 times |
Fri 03 October 2025 |
76.62 (3.44%) |
74.26 |
73.67 - 77.46 |
1.1603 times |
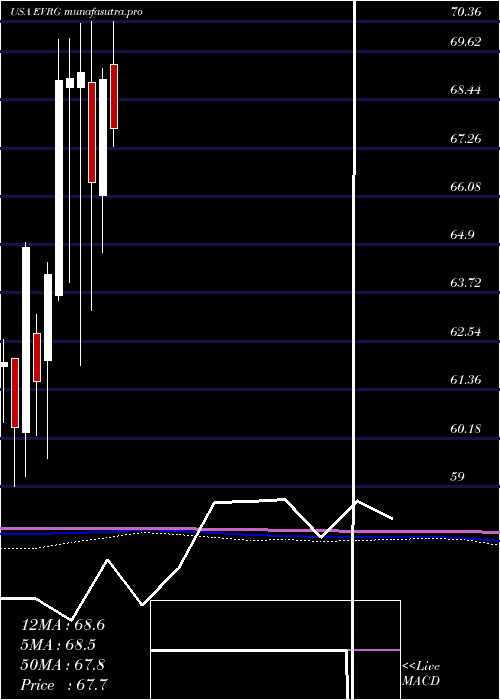
Monthly price and charts EvergyInc Strong monthly Stock price targets for EvergyInc EVRG are 71.83 and 75.65 | Monthly Target 1 | 71.16 | | Monthly Target 2 | 72.49 | | Monthly Target 3 | 74.983333333333 | | Monthly Target 4 | 76.31 | | Monthly Target 5 | 78.8 |
Monthly price and volumes Evergy Inc
| Date |
Closing |
Open |
Range |
Volume |
Thu 04 December 2025 |
73.81 (-4.95%) |
77.41 |
73.66 - 77.48 |
0.1564 times |
Fri 28 November 2025 |
77.65 (1.09%) |
77.50 |
74.76 - 77.71 |
0.8839 times |
Fri 31 October 2025 |
76.81 (1.04%) |
76.00 |
75.36 - 79.32 |
1.1154 times |
Tue 30 September 2025 |
76.02 (6.68%) |
71.00 |
70.42 - 76.18 |
1.1118 times |
Fri 29 August 2025 |
71.26 (0.65%) |
71.00 |
70.37 - 73.97 |
1.0667 times |
Thu 31 July 2025 |
70.80 (2.71%) |
69.30 |
67.30 - 70.85 |
1.1386 times |
Mon 30 June 2025 |
68.93 (3.79%) |
66.10 |
64.70 - 69.20 |
1.0792 times |
Fri 30 May 2025 |
66.41 (-3.89%) |
68.86 |
63.29 - 70.36 |
1.2044 times |
Wed 30 April 2025 |
69.10 (0.22%) |
68.75 |
61.94 - 70.30 |
1.0884 times |
Mon 31 March 2025 |
68.95 (0.06%) |
68.75 |
63.98 - 69.93 |
1.1552 times |
Fri 28 February 2025 |
68.91 (7.39%) |
63.65 |
63.53 - 69.90 |
0.8945 times |
DMA SMA EMA moving averages of Evergy Inc EVRG
DMA (daily moving average) of Evergy Inc EVRG
| DMA period | DMA value | | 5 day DMA | 75.16 | | 12 day DMA | 75.87 | | 20 day DMA | 76.12 | | 35 day DMA | 76.78 | | 50 day DMA | 76.72 | | 100 day DMA | 74.07 | | 150 day DMA | 71.86 | | 200 day DMA | 70.76 | EMA (exponential moving average) of Evergy Inc EVRG
| EMA period | EMA current | EMA prev | EMA prev2 | | 5 day EMA | 74.82 | 75.32 | 75.84 | | 12 day EMA | 75.62 | 75.95 | 76.25 | | 20 day EMA | 75.97 | 76.2 | 76.4 | | 35 day EMA | 76.11 | 76.25 | 76.37 | | 50 day EMA | 76.21 | 76.31 | 76.39 |
SMA (simple moving average) of Evergy Inc EVRG
| SMA period | SMA current | SMA prev | SMA prev2 | | 5 day SMA | 75.16 | 75.82 | 76.28 | | 12 day SMA | 75.87 | 76.14 | 76.33 | | 20 day SMA | 76.12 | 76.27 | 76.41 | | 35 day SMA | 76.78 | 76.92 | 77.03 | | 50 day SMA | 76.72 | 76.72 | 76.7 | | 100 day SMA | 74.07 | 74.01 | 73.95 | | 150 day SMA | 71.86 | 71.83 | 71.79 | | 200 day SMA | 70.76 | 70.73 | 70.69 |
|
|
