Evogene EVGN full analysis,charts,indicators,moving averages,SMA,DMA,EMA,ADX,MACD,RSIEvogene EVGN WideScreen charts, DMA,SMA,EMA technical analysis, forecast prediction, by indicators ADX,MACD,RSI,CCI USA stock exchange
operates under Basic Industries sector & deals in Agricultural Chemicals
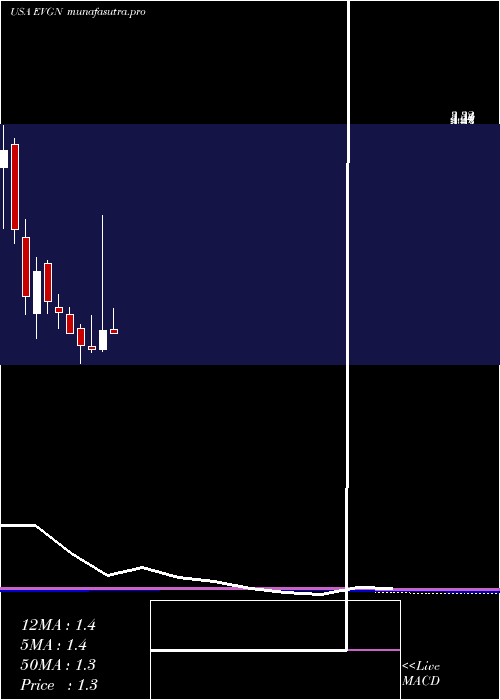
Daily price and charts and targets Evogene Strong Daily Stock price targets for Evogene EVGN are 1.08 and 1.13 | Daily Target 1 | 1.03 | | Daily Target 2 | 1.07 | | Daily Target 3 | 1.0833333333333 | | Daily Target 4 | 1.12 | | Daily Target 5 | 1.13 |
Daily price and volume Evogene
| Date |
Closing |
Open |
Range |
Volume |
Thu 04 December 2025 |
1.10 (3.77%) |
1.05 |
1.05 - 1.10 |
0.7993 times |
Wed 03 December 2025 |
1.06 (0.95%) |
1.06 |
1.03 - 1.08 |
0.9425 times |
Tue 02 December 2025 |
1.05 (1.94%) |
1.03 |
1.03 - 1.06 |
0.5003 times |
Mon 01 December 2025 |
1.03 (-2.83%) |
1.02 |
1.00 - 1.07 |
2.0392 times |
Fri 28 November 2025 |
1.06 (-6.19%) |
1.14 |
1.04 - 1.14 |
1.1691 times |
Wed 26 November 2025 |
1.13 (2.73%) |
1.13 |
1.11 - 1.14 |
0.3806 times |
Tue 25 November 2025 |
1.10 (-4.35%) |
1.13 |
1.09 - 1.15 |
0.8555 times |
Mon 24 November 2025 |
1.15 (1.77%) |
1.11 |
1.08 - 1.26 |
0.7413 times |
Fri 21 November 2025 |
1.13 (4.63%) |
1.10 |
1.09 - 1.15 |
0.8356 times |
Thu 20 November 2025 |
1.08 (-7.69%) |
1.19 |
1.08 - 1.21 |
1.7365 times |
Wed 19 November 2025 |
1.17 (0%) |
1.18 |
1.13 - 1.18 |
1.3558 times |
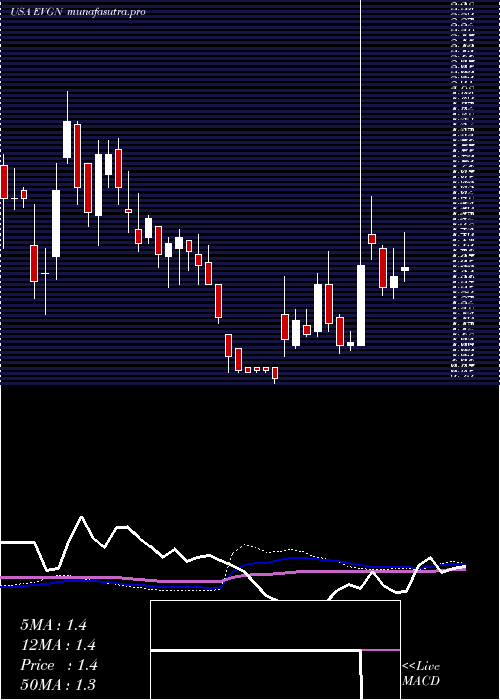
Weekly price and charts Evogene Strong weekly Stock price targets for Evogene EVGN are 1.05 and 1.15 | Weekly Target 1 | 0.97 | | Weekly Target 2 | 1.03 | | Weekly Target 3 | 1.0666666666667 | | Weekly Target 4 | 1.13 | | Weekly Target 5 | 1.17 |
Weekly price and volumes for Evogene
| Date |
Closing |
Open |
Range |
Volume |
Thu 04 December 2025 |
1.10 (3.77%) |
1.02 |
1.00 - 1.10 |
0.5677 times |
Fri 28 November 2025 |
1.06 (-6.19%) |
1.11 |
1.04 - 1.26 |
0.4173 times |
Fri 21 November 2025 |
1.13 (-6.61%) |
1.24 |
1.08 - 1.25 |
0.7663 times |
Fri 14 November 2025 |
1.21 (5.22%) |
1.19 |
1.15 - 1.28 |
0.4519 times |
Fri 07 November 2025 |
1.15 (-8.73%) |
1.25 |
1.12 - 1.25 |
0.4867 times |
Fri 31 October 2025 |
1.26 (0%) |
1.28 |
1.23 - 1.29 |
0.0731 times |
Fri 31 October 2025 |
1.26 (0.8%) |
1.29 |
1.20 - 1.33 |
0.6023 times |
Fri 24 October 2025 |
1.25 (0%) |
1.24 |
1.21 - 1.32 |
0.9775 times |
Fri 17 October 2025 |
1.25 (-3.1%) |
1.33 |
1.23 - 1.49 |
2.019 times |
Fri 10 October 2025 |
1.29 (12.17%) |
1.18 |
1.17 - 1.50 |
3.6383 times |
Fri 03 October 2025 |
1.15 (0.88%) |
1.15 |
1.10 - 1.20 |
0.5925 times |
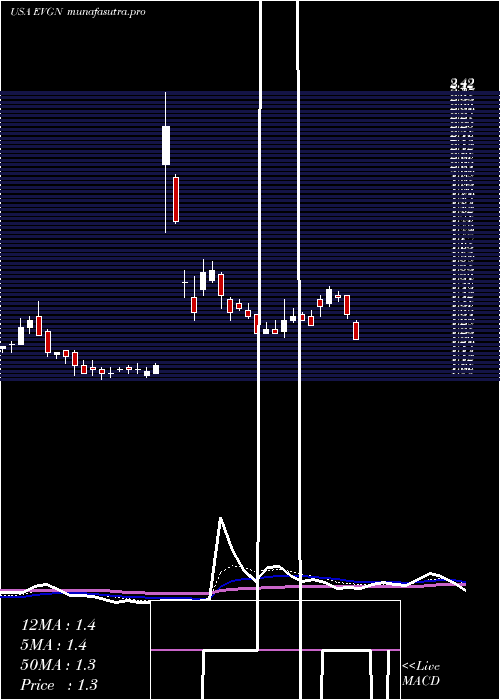
Monthly price and charts Evogene Strong monthly Stock price targets for Evogene EVGN are 1.05 and 1.15 | Monthly Target 1 | 0.97 | | Monthly Target 2 | 1.03 | | Monthly Target 3 | 1.0666666666667 | | Monthly Target 4 | 1.13 | | Monthly Target 5 | 1.17 |
Monthly price and volumes Evogene
| Date |
Closing |
Open |
Range |
Volume |
Thu 04 December 2025 |
1.10 (3.77%) |
1.02 |
1.00 - 1.10 |
0.0166 times |
Fri 28 November 2025 |
1.06 (-15.87%) |
1.25 |
1.04 - 1.28 |
0.0619 times |
Fri 31 October 2025 |
1.26 (10.53%) |
1.17 |
1.10 - 1.50 |
0.2247 times |
Tue 30 September 2025 |
1.14 (-8.8%) |
1.24 |
1.11 - 1.32 |
0.0744 times |
Fri 29 August 2025 |
1.25 (4.17%) |
1.20 |
1.13 - 1.41 |
0.1074 times |
Thu 31 July 2025 |
1.20 (-6.25%) |
1.29 |
1.18 - 1.50 |
0.1586 times |
Mon 30 June 2025 |
1.28 (17.43%) |
1.09 |
1.07 - 2.42 |
7.7273 times |
Fri 30 May 2025 |
1.09 (-3.54%) |
1.12 |
1.06 - 1.43 |
0.0687 times |
Wed 30 April 2025 |
1.13 (-9.6%) |
1.30 |
0.95 - 1.34 |
1.5374 times |
Mon 31 March 2025 |
1.25 (-14.38%) |
1.44 |
1.25 - 1.51 |
0.0231 times |
Fri 28 February 2025 |
1.46 (-7.01%) |
1.51 |
1.30 - 1.64 |
0.0289 times |
DMA SMA EMA moving averages of Evogene EVGN
DMA (daily moving average) of Evogene EVGN
| DMA period | DMA value | | 5 day DMA | 1.06 | | 12 day DMA | 1.1 | | 20 day DMA | 1.14 | | 35 day DMA | 1.19 | | 50 day DMA | 1.21 | | 100 day DMA | 1.23 | | 150 day DMA | 1.25 | | 200 day DMA | 1.25 | EMA (exponential moving average) of Evogene EVGN
| EMA period | EMA current | EMA prev | EMA prev2 | | 5 day EMA | 1.08 | 1.07 | 1.07 | | 12 day EMA | 1.1 | 1.1 | 1.11 | | 20 day EMA | 1.14 | 1.14 | 1.15 | | 35 day EMA | 1.16 | 1.16 | 1.17 | | 50 day EMA | 1.18 | 1.18 | 1.19 |
SMA (simple moving average) of Evogene EVGN
| SMA period | SMA current | SMA prev | SMA prev2 | | 5 day SMA | 1.06 | 1.07 | 1.07 | | 12 day SMA | 1.1 | 1.11 | 1.12 | | 20 day SMA | 1.14 | 1.14 | 1.15 | | 35 day SMA | 1.19 | 1.2 | 1.21 | | 50 day SMA | 1.21 | 1.21 | 1.21 | | 100 day SMA | 1.23 | 1.23 | 1.24 | | 150 day SMA | 1.25 | 1.25 | 1.25 | | 200 day SMA | 1.25 | 1.25 | 1.26 |
|
|
